

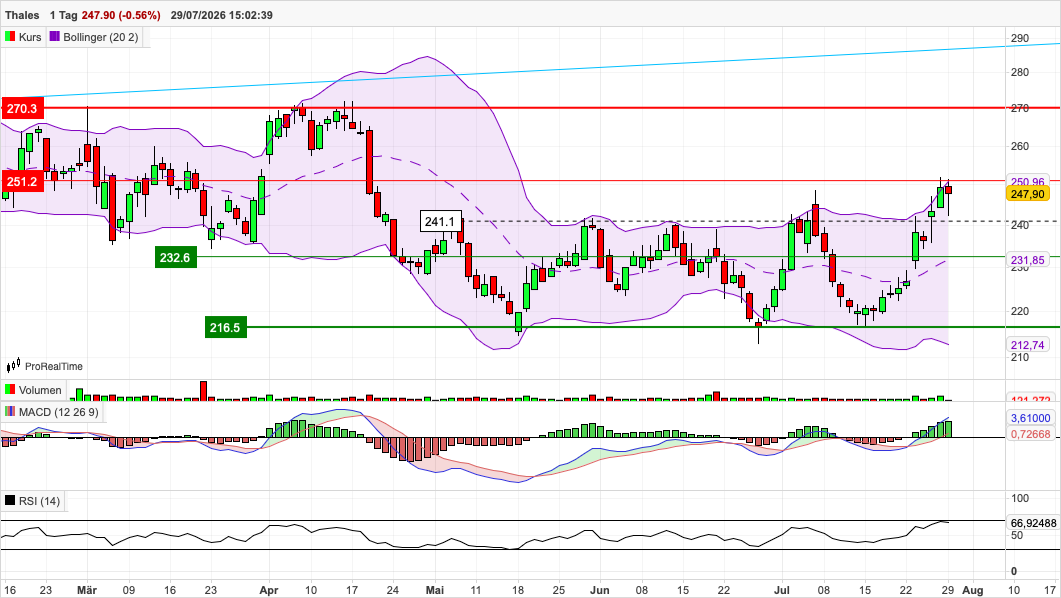
Technical analysis has improved significantly
After several months of consolidation, the Thales chart is now sending a series of positive signals again.
It is particularly noteworthy that not only have individual technical indicators improved, but several factors are pointing in the same direction simultaneously.
We observe exactly this interplay very closely within the MUMAK® methodology.
Successful bottoming out as a starting point
Every sustainable upward movement begins first with stabilization.
Thales has successfully completed exactly this stabilization over the past few months.
The support zone between 216 and 228 euros was successfully defended several times. Sellers increasingly lost influence, while demand gradually built up again on the buy side.
From this bottoming out, a series of higher lows subsequently developed.
A classic characteristic of a beginning uptrend.
Breakout above 241 euros changes the chart pattern
Probably the most important technical step occurred with the breakout above the area of around 241 euros.
This resistance had previously stopped the stock several times.
With the sustainable crossing of this mark, the short-term chart pattern changed significantly.
From a technical analysis perspective, this did not just overcome a resistance.
Rather, the market structure shifted from a neutral sideways movement into a constructive uptrend.
The former resistance now acts as the first important support.
The next target lies in the 251 euro range
Thales is currently working its way toward the next prominent resistance.
This is located in the area of around 251 euros.
This is where it will be decided whether the current movement gains further momentum.
A sustainable breakout above this zone would be of high significance from a technical analysis perspective.
Then the path toward the previous highs in the 270 euro range would open up significantly.
That is exactly why the eyes of many technical market participants are currently focused on this mark.
Breakout at the upper Bollinger Band is particularly striking
One of the most exciting signals is currently provided by the behavior at the Bollinger Bands.
Following the strong half-year figures, the stock not only managed to rise to the upper Bollinger Band.
The price broke out dynamically at the upper end of the Bollinger Bands, while the bands simultaneously widened significantly.
This combination is particularly interesting from a technical perspective.
It often suggests that new momentum is entering the market and buyers are willing to enter even at higher price levels.
At the same time, the rising moving average within the Bollinger Bands shows that the short-term trend has also improved.
In our view, this signal is currently one of the most important arguments for the positive chart pattern.
RSI confirms the momentum
The Relative Strength Index also supports this assessment.
With a value of around 70, the RSI is now moving in the upper range.
At first glance, this could be interpreted as overbought.
However, history repeatedly shows that strong trend stocks can maintain high RSI values for a long time.
The decisive factor is therefore less the absolute level of the indicator and more the fact that it confirms the current high momentum.
The RSI currently signals, above all, strong demand for the stock.
MACD confirms the uptrend
The MACD provides a similar picture.
The indicator is trading above its signal line and continues to move in positive territory.
Momentum has strengthened further, especially after the publication of the half-year figures.
This indicator also confirms the currently intact uptrend.
Several technical signals are pointing upward simultaneously
From our perspective, it is not a single indicator that appears particularly interesting.
Rather, the decisive factor is that several technical factors are currently positive at the same time.
These include:
- successful bottoming out
- series of higher lows
- breakout above the resistance at 241 euros
- approach to the next resistance at 251 euros
- dynamic breakout at the upper Bollinger Band
- positive MACD
- RSI with high momentum
- rising short-term trend
It is precisely this simultaneous occurrence of several positive signals that, in our view, increases the significance of the technical analysis.
Why does Thales receive the RED HOT CHILI™ MUMAK?
The RED HOT CHILI™ MUMAK does not recognize the best company in the world.
It recognizes the company where exactly now the most positive factors coincide simultaneously.
With Thales, we currently see exactly this constellation.
The geopolitical framework remains supportive.
The industry environment is developing positively again.
The fundamentals are convincing – presented in detail in our valuation analysis on MUMAK.me.
And in particular, the technical chart setup has brightened significantly in recent weeks.
It is precisely this interplay that makes Thales this week’s RED HOT CHILI™ MUMAK.
Conclusion
Thales is currently showing one of the most interesting technical chart patterns within our investment universe. After a successful bottoming out, the stock was able to overcome the important resistance at 241 euros and is now working on the next decisive hurdle in the 251 euro range.
We view the dynamic breakout at the upper Bollinger Band in conjunction with a rising MACD and an RSI that confirms the strong momentum as particularly positive. Several technical indicators are sending positive signals simultaneously and suggest significantly improved momentum.
The fundamental quality of the company forms the necessary foundation and has already been presented in detail in our valuation analysis of Thales on MUMAK.me.
From the perspective of the MUMAK® methodology, this currently results in the strongest short-term overall constellation within our analysis universe. That is exactly why Thales receives the award this week RED HOT CHILI™ MUMAK. 

Note:
There can only be one single RED HOT CHILI™ MUMAK at any given time.
The RED HOT CHILI™ MUMAK is an internal designation of the MUMAK® methodology. It identifies the company that, at the time of publication, exhibits the highest alignment across the five MUMAK® analysis categories within our coverage universe.
The designation is based on the MUMAK® methodology as well as our analysis of the current market situation. It identifies the stock that, in our view, offers the most attractive short-term risk-reward profile, the strongest momentum, and the highest alignment across all five analytical levels at the time of publication.
The RED HOT CHILI™ MUMAK does not constitute a buy, sell, or investment recommendation. It solely reflects the outcome of our analytical model at the respective time of publication and makes no statement regarding the future performance of a company or stock. Past performance, current valuations, or designations do not allow reliable conclusions about future performance.
Capital investments involve risks and may result in the loss of invested capital. Every investment decision should be made based on independent review and in consideration of personal investment objectives, investment horizon, and individual risk tolerance.

UMBRELLA Strategy: Inflation and Interest Rates Move the Markets