


Intel Corporation
Valuation
This analysis assesses Intel in line with the MUMAK UMBRELLA Strategy.
The assessment follows five decision phases: Geopolitics, Industry, Fundamentals, Market Sentiment, and Technical Analysis.
The goal is not to predict the future precisely. The goal is orientation. We put facts into context, show cause-and-effect relationships, and structure a transparent decision logic.
We explain – you decide.
Geopolitics
Context
Intel holds a strategically important position in rebuilding modern semiconductor manufacturing in the US and Europe. Government support programs, the push for more resilient supply chains, and the concentration of leading-edge capacity in Asia strengthen the long-term relevance of Intel Foundry.
At the same time, export controls, tariffs, US–China tensions, and potential conflicts around Taiwan could affect demand, access to manufacturing equipment, and customer planning.
Opportunities
- The US and Europe view semiconductors as strategically important infrastructure.
- Intel combines advanced chip design, manufacturing, and packaging in the US.
- Intel could develop into a key Western alternative to Asian contract manufacturers.
Risks
- Export restrictions could limit Intel’s access to the Chinese market.
- Tariffs and changes to government support programs could raise costs or delay investments.
- Intel remains dependent on Asian suppliers and specialized equipment manufacturers.
- Tensions around Taiwan could disrupt supply chains and demand.
Key takeaway: Western efforts to expand domestic semiconductor manufacturing strengthen Intel’s strategic position.
MUMAK.me rating Phase 1: Positive = 1 MUMAK
Intel Corporation
Industry
Context
The semiconductor industry is benefiting from structurally rising demand for AI infrastructure, cloud computing, edge intelligence, and increasingly compute-intensive devices.
With Xeon server processors, client CPUs, networking products, custom chips, advanced packaging technologies, and foundry services, Intel is present across multiple areas. The market opportunity is broad, but competition is particularly intense: NVIDIA leads in AI accelerators, AMD is a strong competitor in processors, and TSMC remains the benchmark in external chip manufacturing.
Valuation comparison: Intel and the semiconductor industry
| Metric | Intel 2026e | Industry average* | Assessment |
|---|---|---|---|
| P/E | -47.1x | approx. 25–40x | The expected GAAP loss in 2026 distorts the comparison |
| EBIT margin | 15.4% | approx. 20–40% | Weaker |
| Net margin | 18.7% | approx. 10–25% | Within range |
| Revenue growth | +19.3% | approx. 10–25% | Within range |
| Free cash flow margin | approx. -2.1% | approx. 15–30% | Significantly below peers’ levels |
*The peer group includes, among others, AMD, NVIDIA, TSMC, Broadcom, and Qualcomm. The industry ranges are for orientation. Intel estimates: MarketScreener, September 2026.
Opportunities
- AI growth supports demand for Intel’s processors, networking, and packaging technologies.
- Manufacturing technologies Intel 18A and 14A could strengthen the foundry business.
- Demand for data-center processors and AI-capable devices is increasing.
- New foundry customers could lift fab utilization and support future earnings development.
Risks
- Intel faces intense competition from NVIDIA, AMD, and TSMC.
- High investment costs continue to weigh on free cash flow.
- Demand for PCs and traditional server processors is cyclical.
- The current valuation already reflects high turnaround expectations.
Key takeaway: Rising demand for AI infrastructure supports Intel’s recovery, while intense competition and high investment costs limit the outlook.
MUMAK.me Assessment Phase 2: Negative = 0 MUMAK
Intel Corporation
Fundamentals
Context
Intel’s business performance improved significantly in Q2 2026. Revenue rose by 25% to USD 16.13 bn, supported by strong demand for data-center and AI processors.
Gross margin and operating profitability also improved. Intel returned to positive adjusted earnings, while the foundry business continued to post a substantial operating loss.
Financial performance
| Key figure | Q2 2026 | Q2 2025 | Change |
|---|---|---|---|
| Revenue | USD 16.13 bn | USD 12.86 bn | +25% |
| GAAP gross margin | 40.4% | 27.5% | +12.9 percentage points / +46.9% |
| GAAP operating income | USD 1.80 bn | −USD 3.18 bn | +156.6% |
| Adjusted net income | USD 2.20 bn | −USD 0.44 bn | Return to profitability |
| Adjusted earnings per share | USD 0.42 | −USD 0.10 | Improved |
| Operating cash flow | USD 7.0 bn | n/a | Strong quarter |
Segment performance
Data Center and AI was Intel’s most important growth driver. Client Computing also delivered higher revenue. Intel Foundry grew as well, but continued to post a substantial operating loss.
| Segment | Revenue Q2 2026 | Growth | Operating income |
|---|---|---|---|
| Client Computing and Physical AI | USD 8.9 bn | +13% | USD 2.34 bn |
| Data Center and AI | USD 6.3 bn | +59% | USD 2.47 bn |
| Intel Products total | USD 15.1 bn | +28% | USD 4.82 bn |
| Intel Foundry | USD 5.8 bn | +31% | −USD 2.09 bn |
Source: Intel Q2 2026 Earnings Release, July 23, 2026.
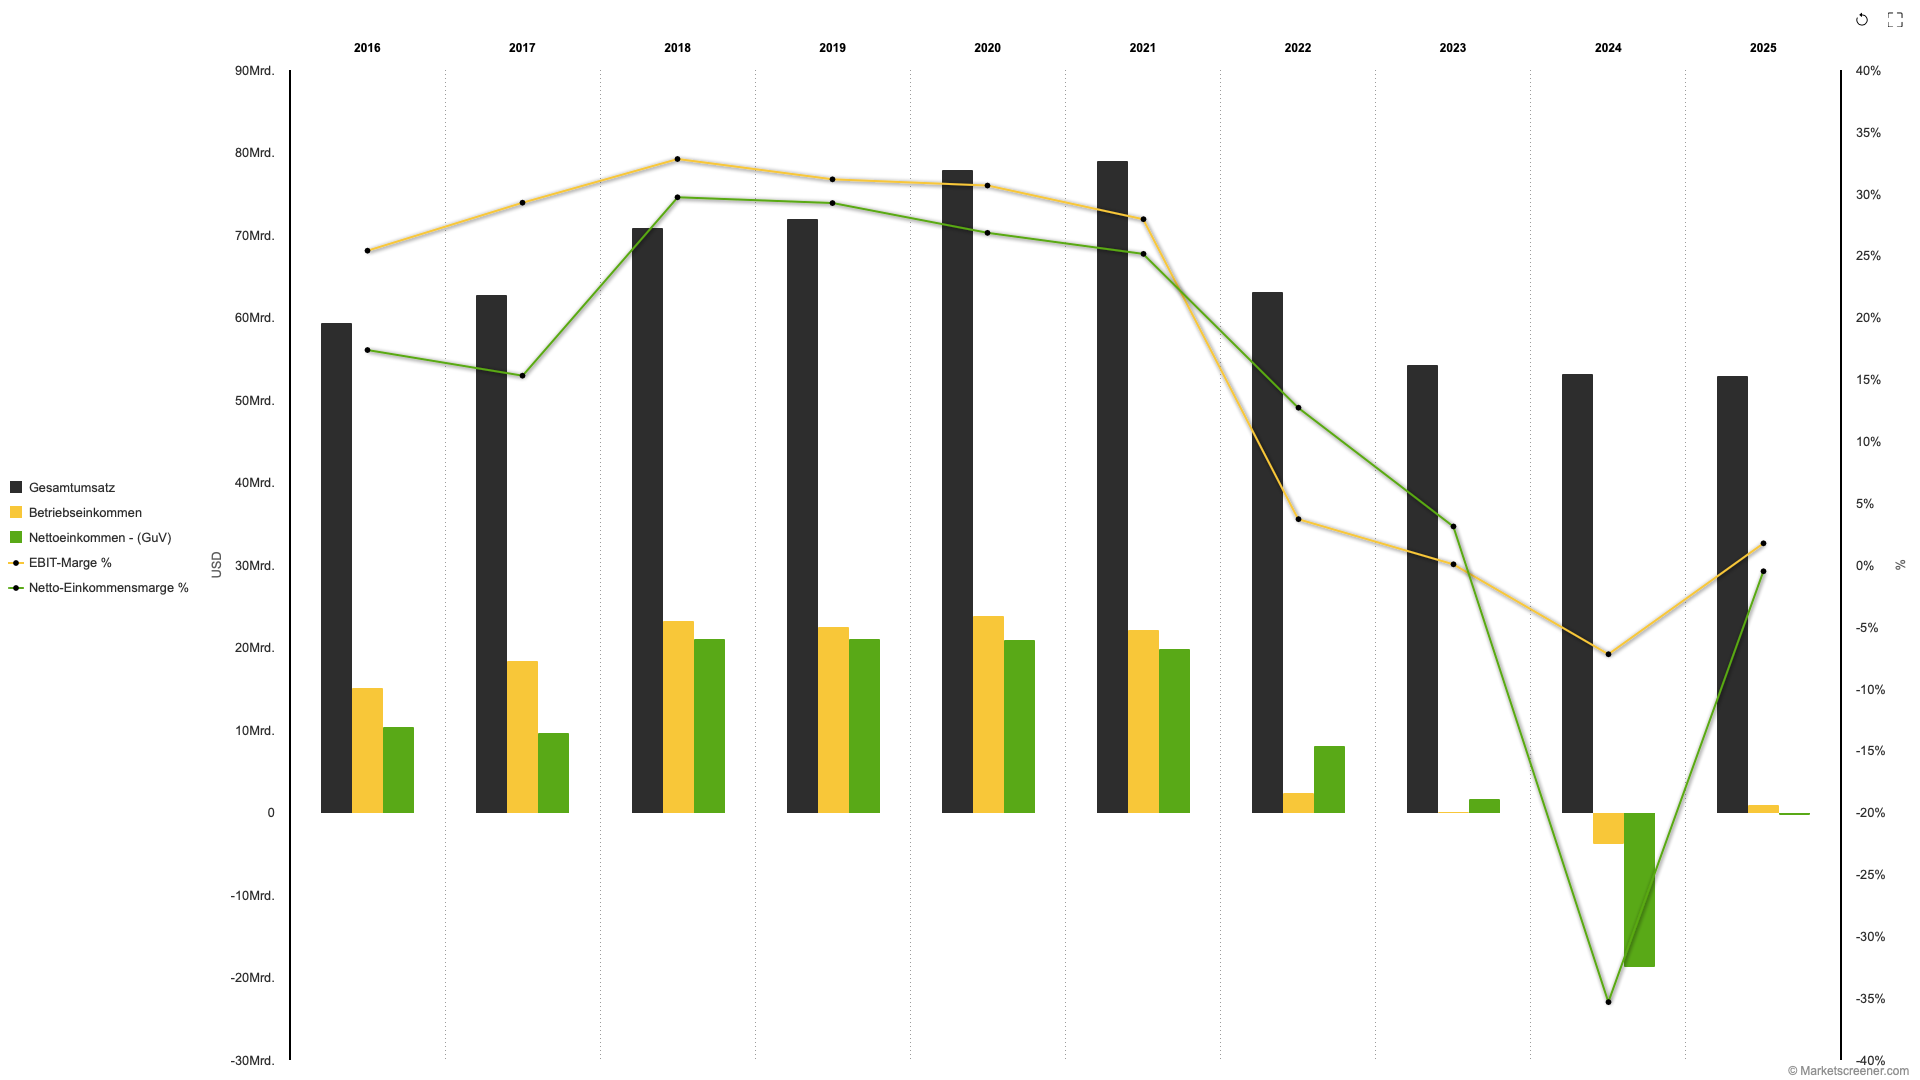
Historical financial performance
Intel’s business performance weakened significantly after 2021. Revenue declined, operating margins fell, and the company posted a substantial net loss in 2024.
The 2025 figures point to an initial stabilization. However, profitability remained well below prior levels.
Financial outlook
Current estimates point to further growth in revenue and operating margin. A recovery in net income is expected for 2027. However, free cash flow could remain negative due to high investment requirements.
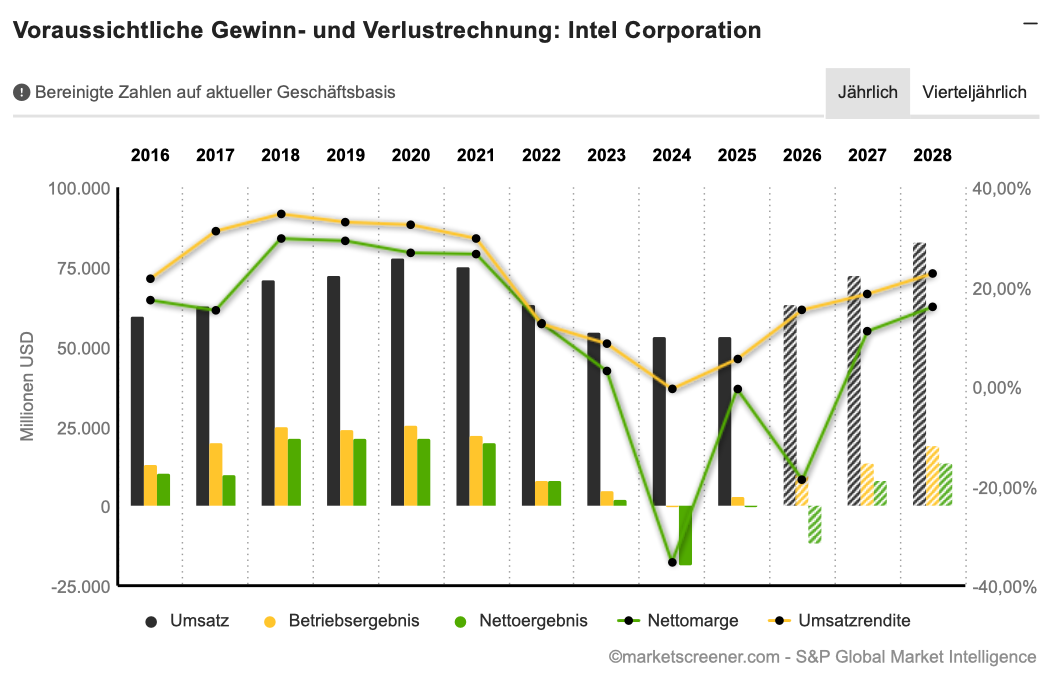
Forecast business development for Intel
| Metric | FY 2025 | FY 2026 | FY 2027 |
|---|---|---|---|
| Revenue | USD 52.85 bn | USD 63.08 bn | USD 72.01 bn |
| Revenue growth | −0.5% | +19.3% | +14.2% |
| EBIT margin | 5.5% | 15.4% | 18.6% |
| Net income | −USD 0.27 bn | −USD 11.81 bn | USD 8.00 bn |
| Free cash flow | −USD 4.95 bn | −USD 1.30 bn | −USD 1.53 bn |
Market estimates expect a recovery in revenue, operating income, and net income through 2028. Source: MarketScreener.
Key Findings
- Revenue rose 25% in the second quarter.
- Data Center and AI was the most important growth driver.
- Margins and operating profitability improved.
- Adjusted earnings returned to positive territory.
- Intel Foundry is growing but continues to record significant losses.
- Further growth is expected for revenue and earnings.
Opportunities
- Demand for AI and data center solutions could support further growth.
- Better production performance could increase margins.
- Intel 18A could attract new foundry customers.
- Positive adjusted earnings support the recovery.
Risks
- Intel Foundry continues to require high investment.
- Free cash flow is expected to remain negative through 2027.
- The recovery depends on stronger demand and higher production yields.
- Extensive balance-sheet adjustments make it difficult to assess reported earnings.
Core message: Strong revenue growth, improved margins, and positive adjusted earnings support a positive fundamental assessment. Intel appears to us as a potential turnaround candidate.
MUMAK.me Assessment Phase 3: Positive = 1 MUMAK
Intel Corporation
News, analysts, and market sentiment
Context
Market sentiment improved after Intel’s strong Q2 2026 results and the higher outlook. Progress in AI processors and the Intel 18A manufacturing technology also strengthened confidence in the company’s recovery.
However, analysts remain divided on valuation and the outlook for the foundry business.
Key developments
- Intel introduced Xeon 6+, its first server processor manufactured on Intel 18A.
- Intel 18A-P entered risk production, while selected Panther Lake processors moved into high-volume manufacturing.
- Intel expects Q3 revenue of USD 15.8 to 16.8 bn and adjusted EPS of around USD 0.38.
- The company continues to expand its manufacturing and advanced-packaging capacity.
- Reports of a potential collaboration with SK hynix supported the share price. However, an agreement has not yet been confirmed.
Analyst consensus
| Metric | Current |
|---|---|
| Average recommendation | ADD |
| Number of analysts | 49 |
| Average price target | approx. USD 116.37 |
| Upside to the average price target | approx. +7% |
| Highest price target | USD 200 |
| Lowest price target | USD 75 |
Source: MarketScreener, September 17, 2026.
Interesting fact
Intel’s revenue growth in Q2 2026 was the strongest in more than 15 years. This shows how quickly AI-driven demand for server solutions and improved manufacturing performance can change the earnings profile of an established semiconductor company.
Key insights
- Revenue rose by 25% in the second quarter.
- Data Center and AI was the most important growth driver.
- Margins and profitability improved.
- Adjusted earnings returned to profitability.
- Intel Foundry is growing, but continues to post losses.
- Further growth is expected for revenue and earnings.
Opportunities
- Demand for AI and data-center solutions could support growth.
- Improved manufacturing performance could lift margins.
- Intel 18A could win new foundry customers.
- Positive adjusted earnings support the recovery.
Risks
- Intel Foundry continues to require high investment.
- Free cash flow is likely to remain negative through 2027.
- The recovery depends on stronger demand and improved manufacturing performance.
- Extensive accounting adjustments make it harder to assess earnings.
Key takeaway: Strong results, progress on Intel 18A and improved analyst sentiment support a positive assessment.
MUMAK.me rating Phase 4: Positive = 1 MUMAK
Intel Corporation
Technical analysis
Context
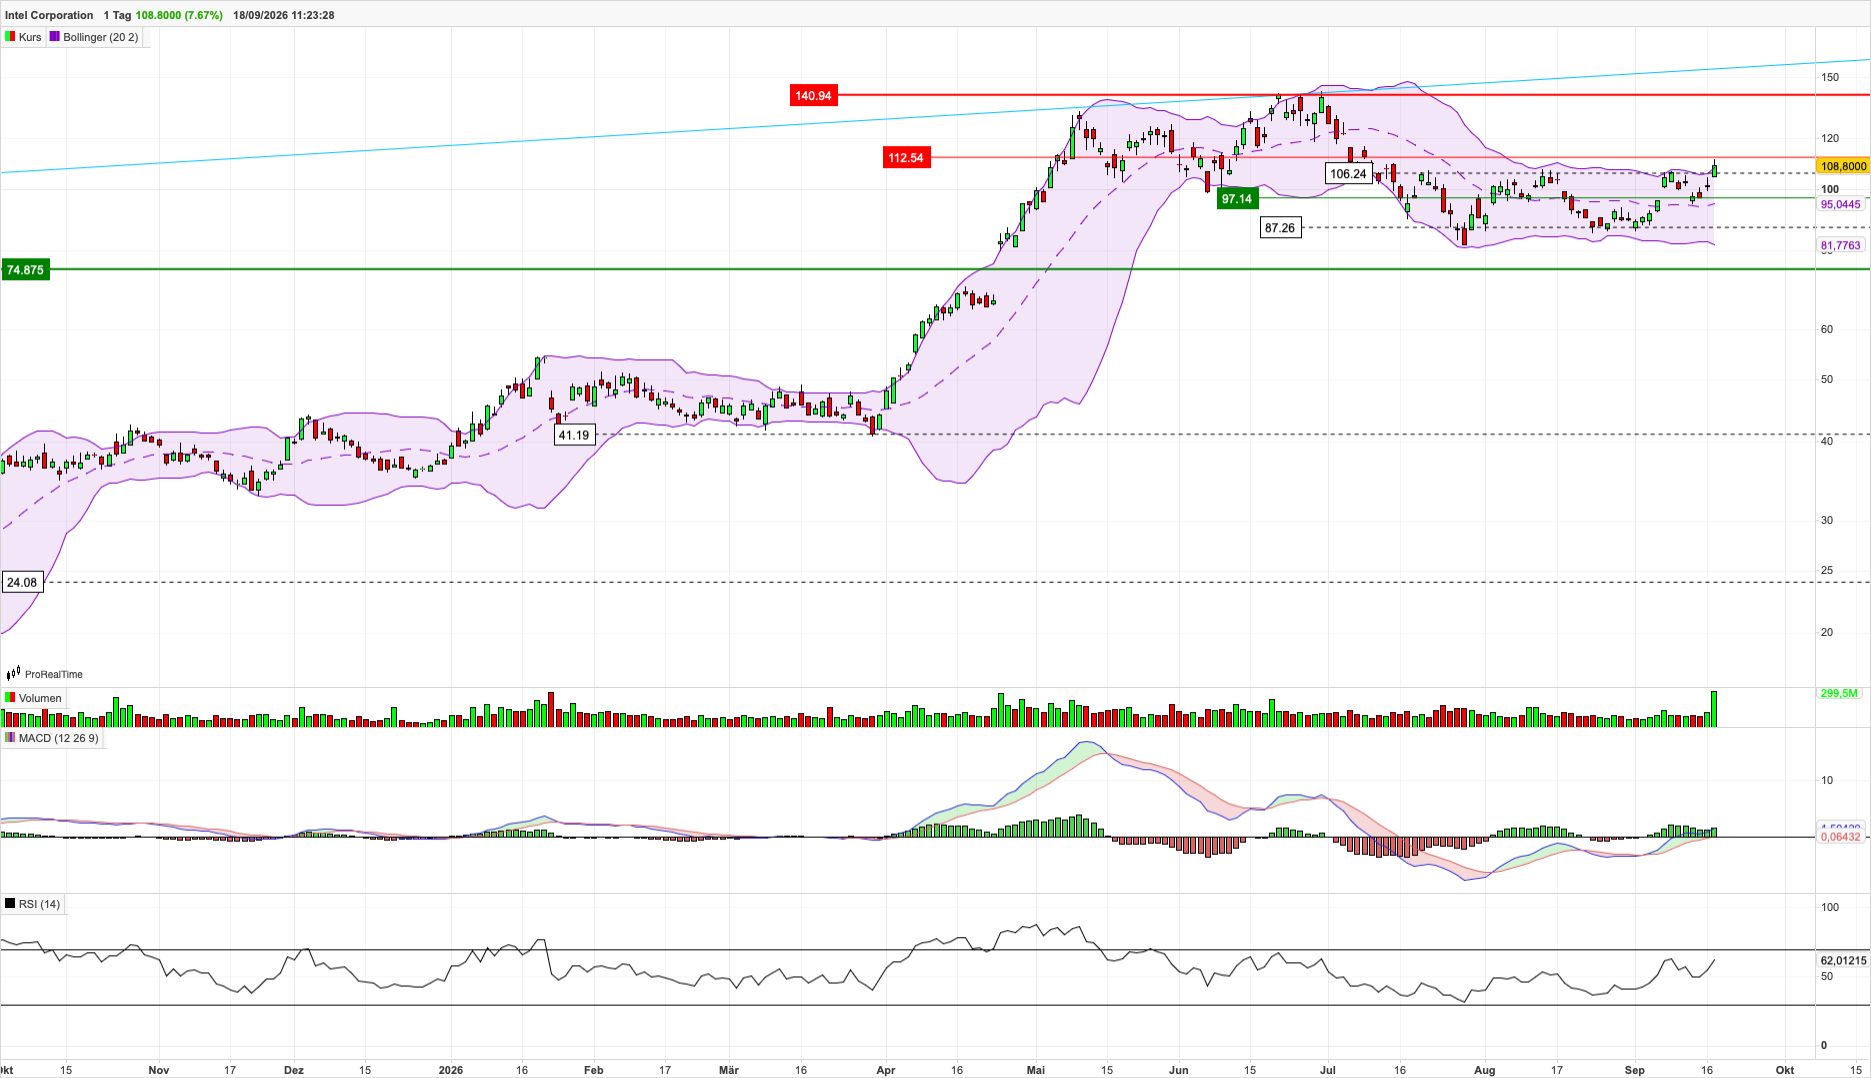
The technical picture for Intel shares appears to have improved significantly. The price moved back above USD 100 and also broke through the previous resistance zone around USD 104 to 105.
The recent rise to around USD 108.80 was accompanied by high trading volume. The next key resistance is around USD 112.50. Initial support is around USD 97, followed by the middle Bollinger band at around USD 95.
Development over recent weeks/months
(as of: September 18, 2026)
Technical indicators
| Indicator | Rating | Interpretation |
| RSI (14) | Positive | At around 62 – positive momentum without overbought signal |
| MACD | Positive | Bullish signal with increasing momentum |
| Bollinger Bands | Positive | The price is above the upper band – a sign of strong momentum, but there is a short-term consolidation risk |
Opportunities
- The move above USD 104 to 105 reinforces the positive trend.
- A breakout above USD 112.50 could support further gains.
- RSI and MACD confirm the positive momentum.
- High trading volume supports the recent price increase.
Risks
- The price is trading above the upper Bollinger band and could consolidate first.
- A drop below USD 100 would weaken the breakout signal.
- A break of the support zone at USD 97 to 95 would cloud the positive technical outlook.
- Reports of a potential collaboration with SK hynix have not yet been confirmed and could trigger additional volatility.
Key takeaway: The breakout above USD 104 to 105 accompanied by high trading volume and positive momentum indicators confirms the positive technical assessment.
MUMAK.me Assessment Phase 5: Positive = 1 MUMAK
Intel Corporation
What supports Intel?
- Revenue, margins, and adjusted earnings are improving.
- Demand in Data Center and AI is growing strongly.
- Intel has a strategically important manufacturing position in the US.
- Intel 18A ramp-up and fab performance continue to progress.
- Analyst sentiment and the technical trend are positive.
What argues against Intel?
- Intel Foundry continues to post high losses.
- High investment costs weigh on free cash flow.
- The current valuation already reflects high recovery expectations.
- Intel faces intense competition from NVIDIA, AMD, and TSMC.
- Export restrictions and geopolitical tensions increase supply-chain risks.
What we are watching
- The Q3 2026 results expected for October 2026, especially revenue, gross margin, and adjusted earnings.
- Further growth in Data Center and AI.
- Capex and the development of free cash flow.
Summary
Intel’s recovery is gaining momentum. Q2 2026 showed stronger revenue growth, improved profitability, and strong demand for data-center and AI processors.
At the same time, Intel Foundry continues to post losses. Free cash flow is likely to remain negative through 2027, and the current valuation already reflects high expectations. Further progress depends on sustained growth, improved manufacturing performance, and winning new foundry customers.
Rating According to the MUMAK Method
| Category | Rating |
|---|---|
| Geopolitics | Positive |
| Sector | Negative |
| Fundamentals | Positive |
| News & Sentiment | Positive |
| Technical analysis | Positive |
Overall Rating


