


Johnson & Johnson
Since our last analysis, Johnson & Johnson has continued its positive operational and strategic development.
The company published strong results for the second quarter of 2026 and raised its full-year guidance. At the same time, Johnson & Johnson achieved further progress in its pharmaceutical product pipeline and announced a proposed settlement for the remaining lawsuits related to ovarian cancer and talc products. This could significantly reduce a long-standing legal uncertainty.
The technical picture has also improved. The share price has risen above its previous resistance level, while RSI and MACD continue to indicate positive momentum.
Overall, recent developments confirm our positive assessment of Johnson & Johnson.
Rating
This analysis evaluates Johnson & Johnson according to the UMBRELLA strategy using the MUMAK method.
The valuation is conducted across five decision-making phases: Geopolitics, Industry, Fundamentals, Market Sentiment, and Technical Analysis.
The goal is not to predict the future precisely. The goal is orientation. We contextualize facts, demonstrate causal relationships, and structure a comprehensible decision logic.
We explain – you decide.
Geopolitics
Classification
The geopolitical and demographic environment remains supportive for the global healthcare industry as a whole.
Aging populations, rising healthcare spending, and growing demand for innovative therapies create structural growth opportunities, particularly in oncology, immunology, cardiovascular disease, and medical technology.
Johnson & Johnson benefits from its global presence and broadly diversified product portfolio. In addition, demand in the healthcare sector is typically far less cyclical than in many other industries.
However, governments in the United States and Europe are increasingly focused on containing healthcare costs. Drug pricing, reimbursement policy, and regulatory intervention therefore remain important structural risks.
Opportunities
- Aging populations support structurally rising demand for healthcare services.
- Oncology, immunology, and neuroscience remain important long-term growth markets.
- Healthcare spending proves comparatively robust even during economic downturns.
- Johnson & Johnson’s global presence reduces dependence on individual markets.
- Innovations in medical technology create additional structural growth opportunities.
Risks
- Increasing political pressure on drug pricing, particularly in the United States.
- Reimbursement system reforms could limit pricing power for innovative drugs.
- Regulatory requirements are becoming increasingly complex.
- Global supply chains in the pharmaceutical and medical technology industries remain exposed to geopolitical disruptions.
Key takeaway: Demographic trends and structurally rising demand for healthcare services create a favorable long-term environment for Johnson & Johnson.
MUMAK.me Rating Phase 1: Positive = 1 MUMAK
Johnson & Johnson
Industry
Assessment
The healthcare sector remains one of the most attractive industries globally with structural growth.
Johnson & Johnson holds a particularly strong position, as the company combines two complementary business segments: Innovative Medicine and MedTech.
The pharmaceutical business offers access to high-growth areas such as oncology, immunology, and neuroscience, while MedTech provides additional diversification through surgery, cardiovascular technologies, orthopedics, and ophthalmology.
This diversification reduces dependence on individual therapeutic areas and distinguishes Johnson & Johnson from many competitors in the pharmaceutical industry.
Johnson & Johnson in Valuation Comparison
| Metric | Johnson & Johnson 2026e | Industry average* | Rating |
|---|---|---|---|
| P/E 2026e | 29.2x | approx. 21–24x | Weaker / Highly valued |
| EBIT margin | 32 % | approx. 22–28% | Stronger |
| Net margin | approx. 29% | approx. 17–23% | Stronger |
| Revenue Growth | approx. 7% | approx. 4–7% | In line |
| Dividend Yield | approx. 2% | approx. 2.0–2.5% | Within range |
* Peer group: Roche, Merck & Co., Novartis, AstraZeneca, Abbott Laboratories, and AbbVie. Source:MarketScreener consensus estimates and market data, August 2026.
Opportunities
- Innovative Medicine offers access to structurally growing therapeutic markets.
- MedTech provides additional diversification and reduces dependence on the pharmaceutical business.
- Oncology remains one of the strongest long-term growth areas in the healthcare sector.
- The company’s size enables substantial investments in research, clinical development, and acquisitions.
- A broadly diversified portfolio reduces dependence on individual blockbuster products.
Risks
- Johnson & Johnson is trading at a valuation premium relative to parts of the pharmaceutical peer group.
- Patent expirations can significantly impact the development of individual products.
- Competition for innovative therapies in oncology and immunology remains intense.
- Rising healthcare costs increase political pressure as well as pressure on reimbursement systems.
Key takeaway: The combination of Innovative Medicine and MedTech makes Johnson & Johnson an exceptionally diversified healthcare platform. The higher valuation reflects this quality, but at the same time reduces the margin of safety for investors.
MUMAK.me Evaluation Phase 2: positive = 1 MUMAK
Johnson & Johnson
Fundamentals
Assessment
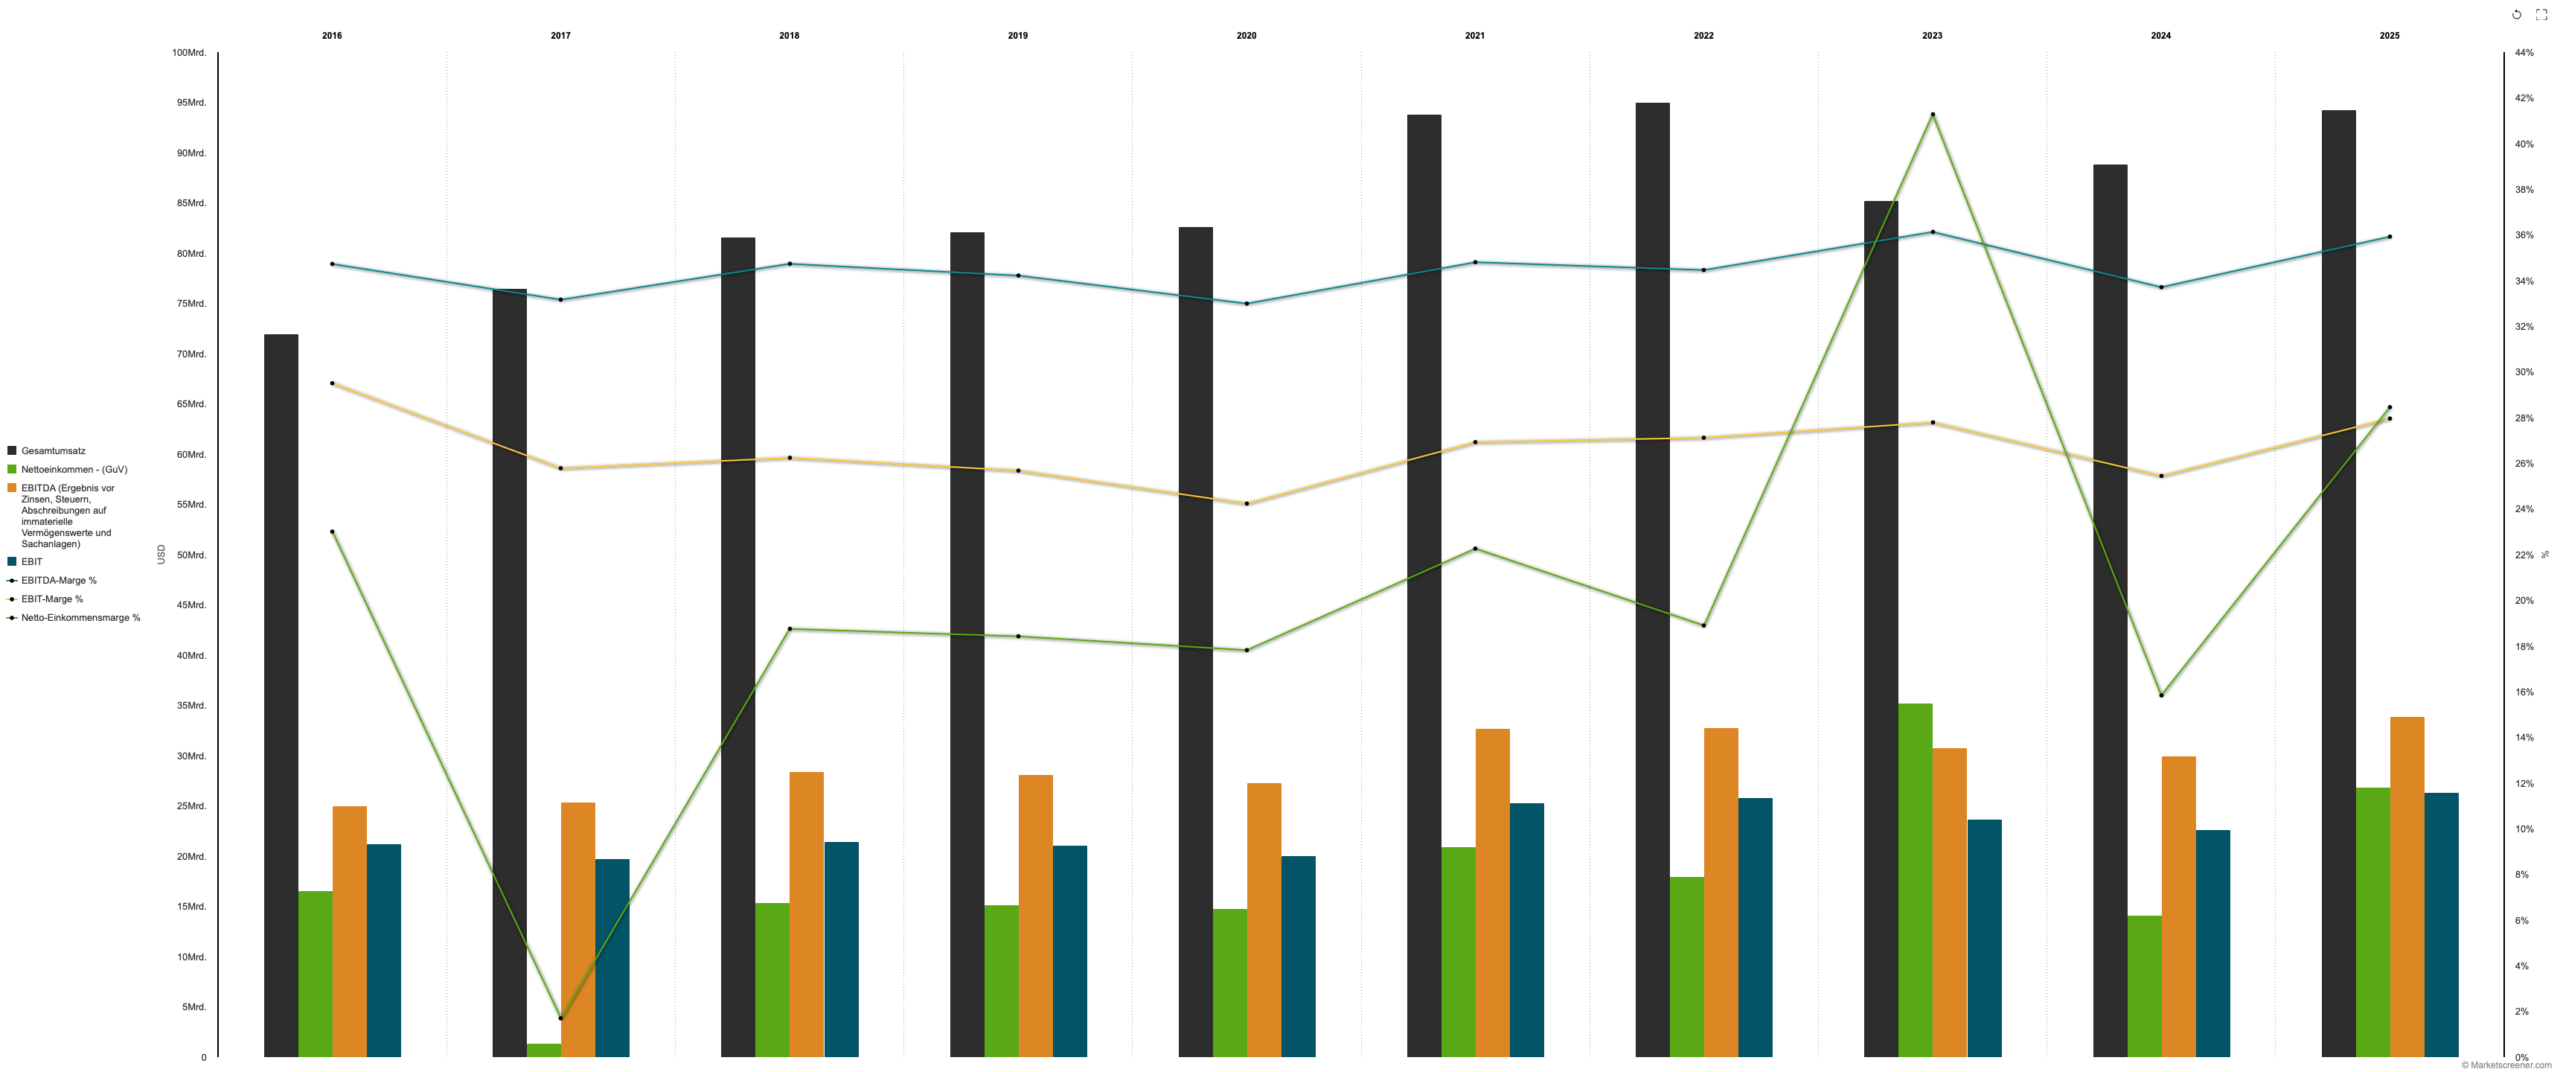
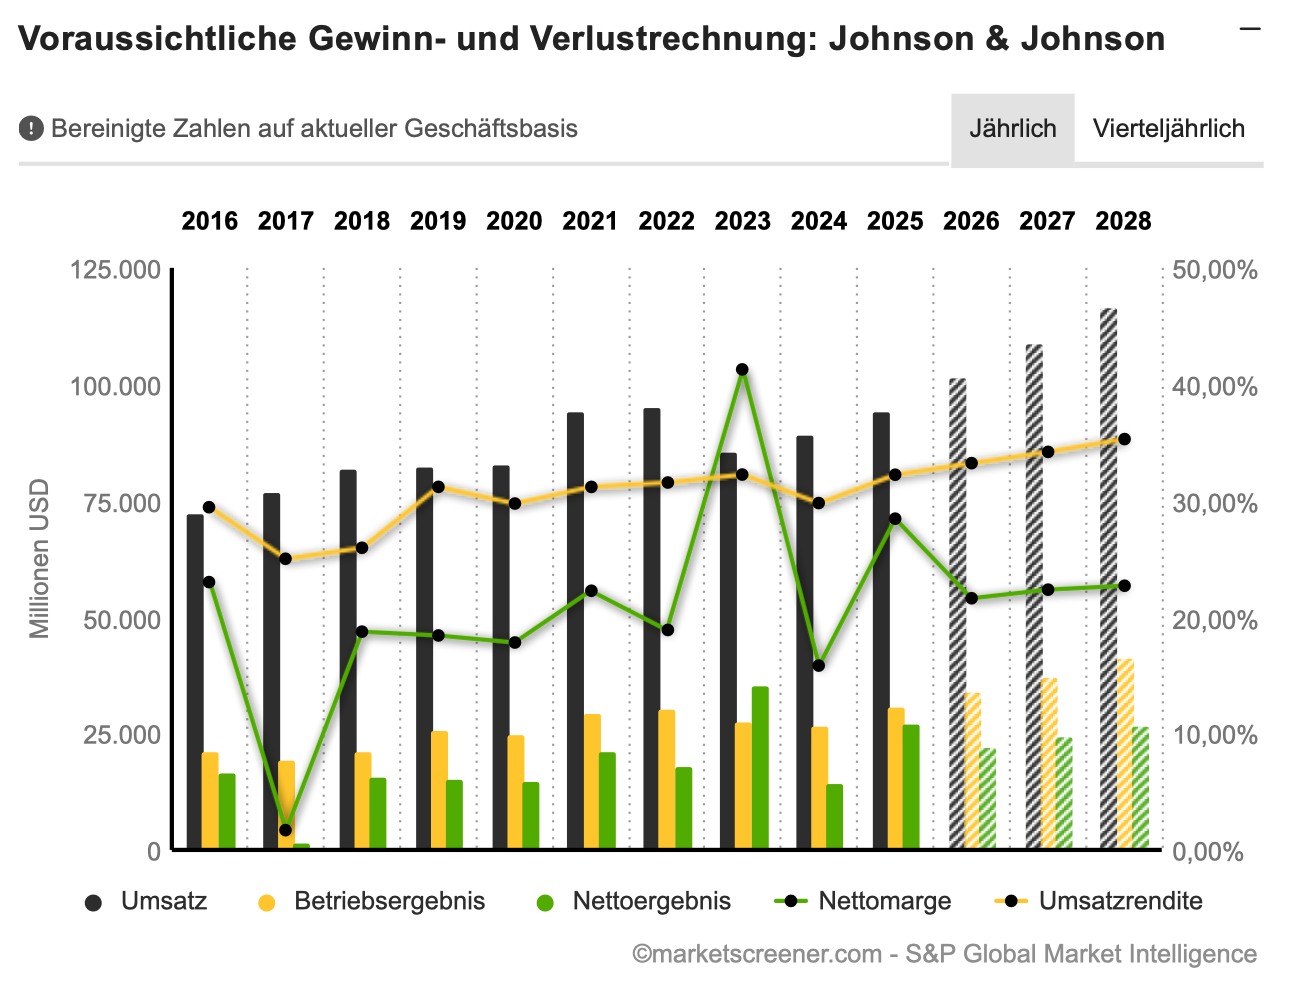
In the second quarter of 2026, Johnson & Johnson once again reported strong business figures, confirming its position as one of the highest-quality healthcare companies worldwide. Growth was driven by both the Innovative Medicine and MedTech segments. Due to improved operational performance, management raised its full-year 2026 outlook despite ongoing competition from Stelara biosimilars.
Financial Metrics
| Metric | Q2 2026 | Q2 2025 | Change |
|---|---|---|---|
| Revenue | $25.31 bn | $23.74 bn | +6,6 % |
| Net Profit | $5.53 bn | $5.54 bn | -0,1 % |
| Diluted EPS | $2.27 | $2.29 | -0,9 % |
| Adjusted net income | $7.08 bn | $6.70 bn | +5,7 % |
| Adjusted EPS | $2.90 | $2.77 | +4,7 % |
| Free cash flow (YTD) | approx. $8.7 bn | $6.2 bn | Significant improvement |
Revenue by business segment
| Segment | Revenue Q2 2026 | Reported | Change |
|---|---|---|---|
| Innovative Medicine | $16.38 bn | +7,8 % | +6,8 % |
| MedTech | $8.93 bn | +4,5 % | +3,6 % |
Updated guidance for 2026
Johnson & Johnson raised its full-year guidance following the strong second quarter.
The company now expects reported sales of approximately $100.8–101.4 billion.
| Financial guidance | FY2024 | FY2025 | FY2026e |
|---|---|---|---|
| Revenue | $88.8 bn | $94.2 billion | approx. $101 bn |
| Revenue Growth | approx. 4% | approx. 6% | approx. 7% |
| EBITDA Margin | approx. 35% | approx. 36% | approx. 37% |
| Adjusted EPS | $9.98 | $10.80 | $11.60–$11.75 |
| Free Cash Flow | $18.0 bn | $17.2 billion | approx. $18–$20 bn |
Source: MarketScreener.
Opportunities
- Darzalex, Carvykti, Tremfya, and Spravato continue to support growth in the pharmaceutical business.
- The oncology pipeline offers several additional opportunities for future revenue growth.
- Improving free cash flow creates substantial financial flexibility.
- Strong cash flow generation supports investments in research and development, acquisitions, share buybacks, and dividend growth.
- Johnson & Johnson remains one of the most established companies with continuous dividend growth in the global healthcare sector.
Risks
- Sales of Stelara are increasingly under pressure from biosimilar competition.
- New products must offset declining sales of established blockbuster drugs.
- Acquisitions and investments in the product pipeline must deliver sufficient returns over the long term.
- The comparatively high valuation increases sensitivity to weaker-than-expected earnings growth.
Key takeaway: Johnson & Johnson’s overall fundamental picture remains strong. Growth in Innovative Medicine and MedTech, improving free cash flow, and the raised 2026 guidance form a solid foundation.
MUMAK.me Assessment Phase 3: Positive = 1 MUMAK
Johnson & Johnson
News, Analysts, and Market Sentiment
Assessment
Market sentiment toward Johnson & Johnson remains positive following the strong second-quarter results.
Another important development concerns the long-standing litigation related to talc products. In July, Johnson & Johnson announced a proposed comprehensive settlement intended to cover the remaining approximately 76,000 lawsuits related to ovarian cancer and talc products—subject to sufficient participation and further conditions.
Should this settlement be successfully concluded, it could significantly reduce one of the most persistent uncertainties surrounding the company.
At the same time, the pharmaceutical pipeline continues to advance. The FDA granted RYBREVANT FASPRO Priority Review status for the treatment of recurrent or metastatic head and neck cancer, further strengthening Johnson & Johnson’s position in oncology.
Analyst Consensus
| Average Consensus | ACCUMULATE |
| Number of Analysts | 23 |
| Average Price Target | approx. $272 |
| Upside to the average target | approx. +4% |
| Highest price target | $305 |
| Lowest Price Target | USD 190 |
Source: MarketScreener, as of August 2026.
Interesting Fact
Johnson & Johnson is on track to achieve annual revenue exceeding $100 billion for the first time in its over 140-year corporate history. This underscores the successful transformation of the company into a leading provider of innovative pharmaceuticals and modern medical technology.
Opportunities
- The raised 2026 guidance strengthens confidence in operational execution.
- A potential resolution of the remaining litigation related to ovarian cancer and talc products could reduce a significant long-term uncertainty.
- The FDA’s Priority Review for RYBREVANT FASPRO underscores continued progress in the product pipeline.
- Strongly growing products are increasingly offsetting declining sales of Stelara.
Risks
- The proposed talc litigation settlement remains subject to certain conditions and therefore does not immediately eliminate legal risk.
- Following the strong share price performance, the further upside potential expected by analysts is now more limited.
- Disappointing clinical trial results or regulatory decisions could weigh on market sentiment.
Key takeaway: Market sentiment remains positive, supported by strong business results and progress in the product pipeline.
MUMAK.me Evaluation Phase 4: Positive = 1 MUMAK
Johnson & Johnson
Technical Analysis
Assessment
The technical picture of Johnson & Johnson remains positive.
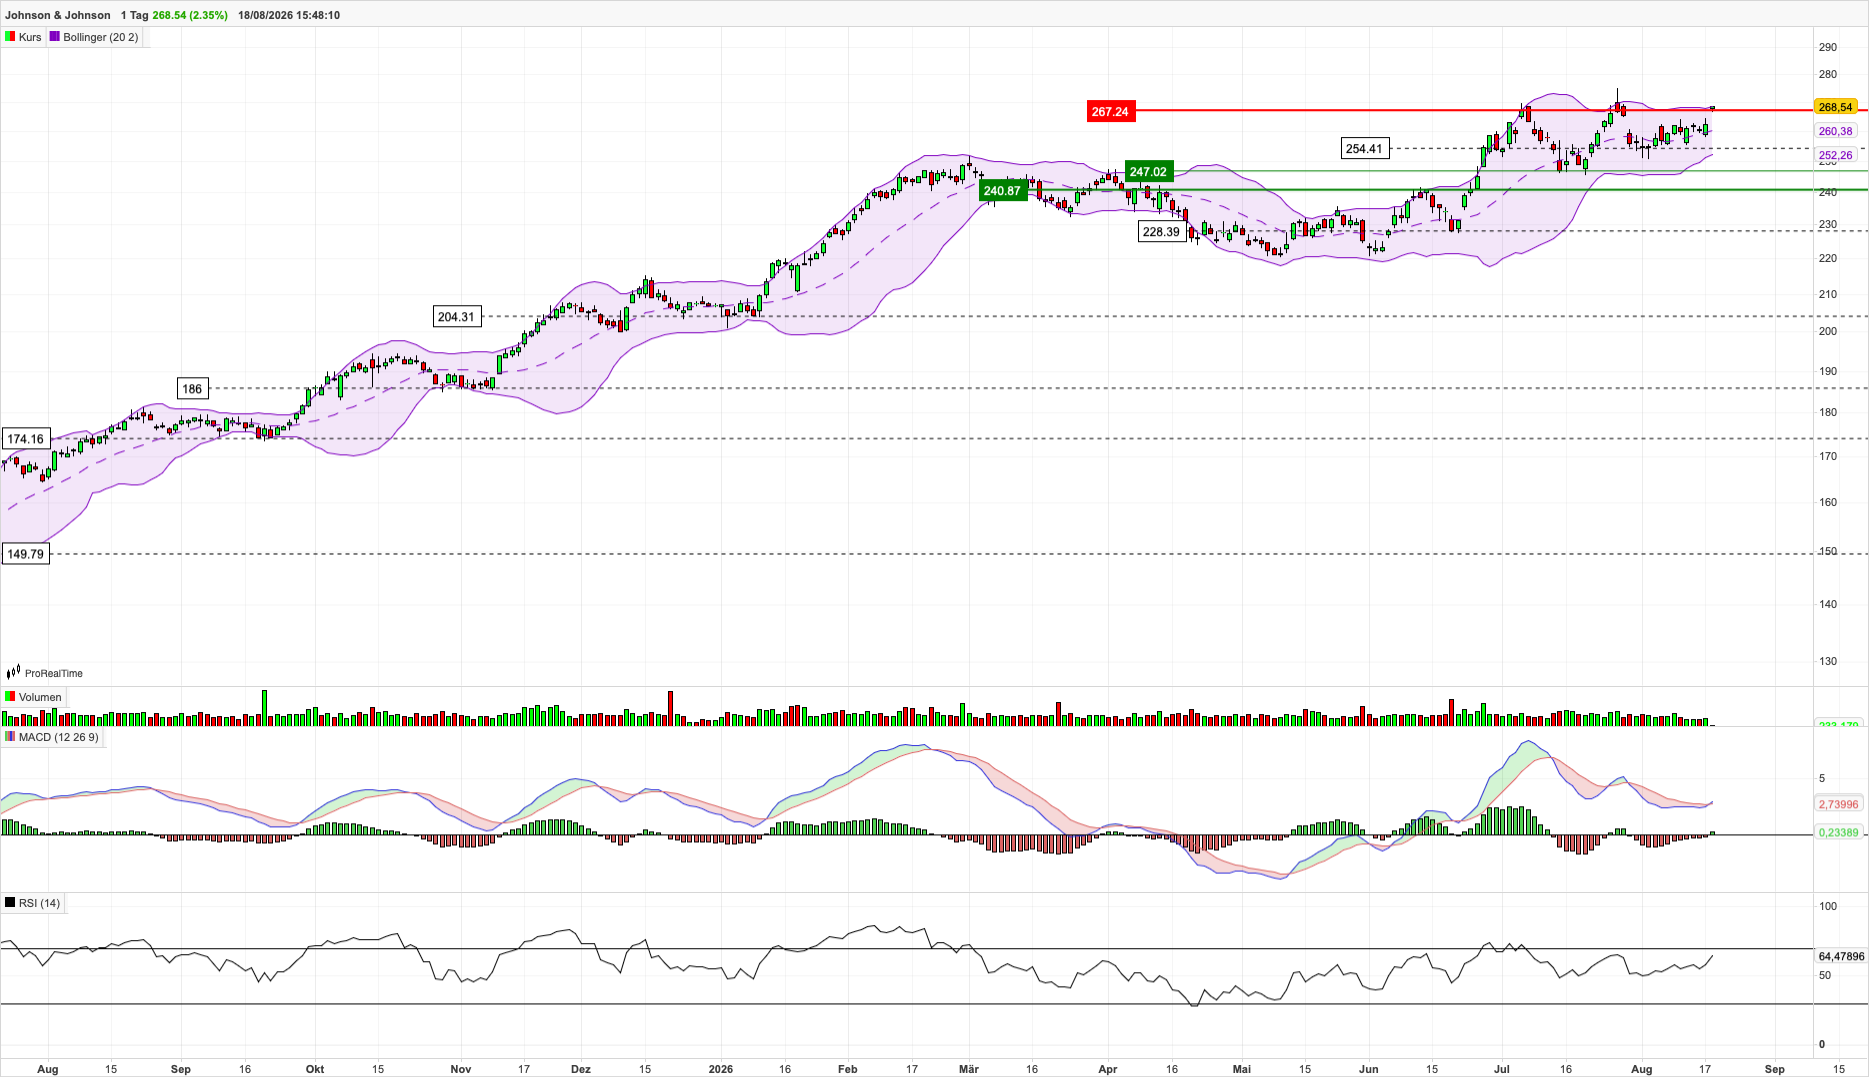
On August 18, 2026, the stock was trading at approximately $268.54, slightly above the previous resistance level of around $267.24. This is an important technical development, as a sustained rise above this level could confirm a continuation of the medium-term uptrend.
Performance over recent weeks/months (as of August 18, 2026)
| Indicator | Rating | Interpretation |
|---|---|---|
| RSI (14) | Positive | At around 64.5; momentum is positive, while the stock is not yet in overbought territory. |
| MACD | Positive | The MACD remains slightly above the signal line, thereby supporting positive upward momentum. |
| Bollinger Bands | Positive | The share price is above the middle band and moving toward the upper Bollinger Band. |
RSI (14)
Positive
- RSI at around 64.5: Momentum remains positive.
- Above 50: Buying pressure is stronger than selling pressure.
- Not overbought: The RSI remains below the usual overbought threshold of 70.
Interpretation
The RSI signals positive momentum without current signs of an overbought market.
MACD (12/26/9)
Positive
- Positive MACD: The MACD remains above the zero line.
- Bullish signal: The MACD line is slightly above the signal line.
- Improved momentum: The MACD indicates that upward momentum is strengthening again.
Interpretation
The MACD supports the current uptrend, although the bullish signal remains moderate.
Bollinger Bands (20)
Positive
- Middle band: The middle Bollinger Band is at approximately $260.38.
- Lower band: The lower Bollinger Band is at approximately $252.26.
- Resistance at $267.24: The share price has moved slightly above this important resistance level.
Interpretation
The Bollinger Bands confirm the positive overall technical picture. The share price is trading above the middle band and moving in the upper range of the Bollinger bandwidth.
Opportunities
- Positive momentum: The share price has recovered significantly and remains in an uptrend.
- Healthy RSI: The RSI is above 50 but remains below overbought territory.
- Positive MACD: The indicator supports a possible continuation of the upward movement.
Risks
- Breakout not yet confirmed: The share price must hold sustainably above the recent resistance level.
- Relatively high RSI: Momentum is strong; however, the risk of a short-term correction is rising.
- Weakening momentum: A decline below the middle Bollinger Band would weaken the positive technical picture.
Key takeaway: The technical picture of Johnson & Johnson remains positive. The stock has moved slightly above the important resistance level of $267.24, supported by positive RSI and MACD signals. A sustained breakout above this level would further confirm the uptrend.
MUMAK.me Assessment Phase 5: Positive = 1 MUMAK
Johnson & Johnson
What speaks for Johnson & Johnson?
- Raised 2026 full-year guidance after a strong second quarter.
- Diversified business model with Innovative Medicine and MedTech segments.
- Globally leading oncology portfolio with Darzalex and Carvykti as growth drivers.
- Very strong balance sheet and excellent free cash flow generation.
- Dividend Aristocrat with more than 60 consecutive dividend increases.
- Broad late-stage pipeline and targeted acquisitions like Firefly Bio strengthen long-term growth.
What speaks against Johnson & Johnson?
- Ongoing revenue decline for Stelara due to biosimilar competition.
- Increasing price and reimbursement pressure in key healthcare markets.
- The ongoing talc lawsuits remain a factor of uncertainty despite improved transparency.
- Regulatory and clinical risks in the development of new products.
- The premium valuation leaves only limited room for operational disappointments.
What we are watching
- Implementation of the raised 2026 full-year guidance.
- Further growth of Darzalex, Carvykti, Tremfya, Spravato, Tecvayli and Talvey.
- Successful replacement of declining Stelara revenues with new products.
- Integration of Firefly Bio and progress of the oncology pipeline.
- Further approvals of new drugs and product launches in the MedTech sector in the second half of 2026.
Summary
Johnson & Johnson continues to confirm its strong position within the UMBRELLA strategy. The strong second-quarter results, the raised 2026 guidance, and the sustained growth in key areas of Innovative Medicine and MedTech underscore the strength of the underlying business.
Progress in the pharmaceutical product pipeline supports future growth, while the proposed settlement of the remaining lawsuits related to ovarian cancer and talc products could significantly reduce a long-standing uncertainty. At the same time, the technical picture also remains positive, with the share price having surpassed an important resistance level.
Overall, the diversified business model, the leading oncology portfolio, strong cash flow generation, and the broadly positioned product pipeline continue to support our positive long-term assessment of Johnson & Johnson.
Rating According to the MUMAK Method
| Category | Rating |
|---|---|
| Geopolitics | Positive |
| Industry | Positive |
| Fundamentals | Positive |
| News & Sentiment | Positive |
| Technical Analysis | Positive |
Overall Rating


