

Why the stock is particularly convincing right now
With the RED HOT CHILI™ MUMAK, MUMAK® highlights every week the company that currently shows the greatest alignment across our five analysis levels:
- Geopolitics
- Industry
- Fundamentals
- News & Market Sentiment
- Technical Analysis
This week, Johnson & Johnson receives this award.
The robust operational development, the raised annual guidance, and the company’s strong position in the Innovative Medicine and MedTech sectors form a fundamentally constructive starting position. In parallel, the overall technical chart picture has also continued to improve recently.
We have already extensively presented Johnson & Johnson’s fundamental valuation on MUMAK.me. The focus of this update is therefore on the current technical chart development.
Fundamental Quality Meets New Momentum
Johnson & Johnson is currently convincing not only through its strong market position and a broadly diversified business model.
From our perspective, the following factors in particular indicate a fundamentally positive starting position:
- Revenue growth in the second quarter
- Growth in Innovative Medicine and MedTech
- Improved adjusted earnings
- Significant improvement in free cash flow
- Raised annual guidance for 2026
- Growth of key products such as Darzalex, Carvykti, Tremfya, and Spravato
- Broad product pipeline in several important therapeutic areas
Johnson & Johnson achieved revenue of approximately $25.3 billion in the second quarter and subsequently raised its full-year guidance.
This fundamental development forms the basis for the current RED HOT CHILI™ MUMAK award.
Technical analysis provides additional support
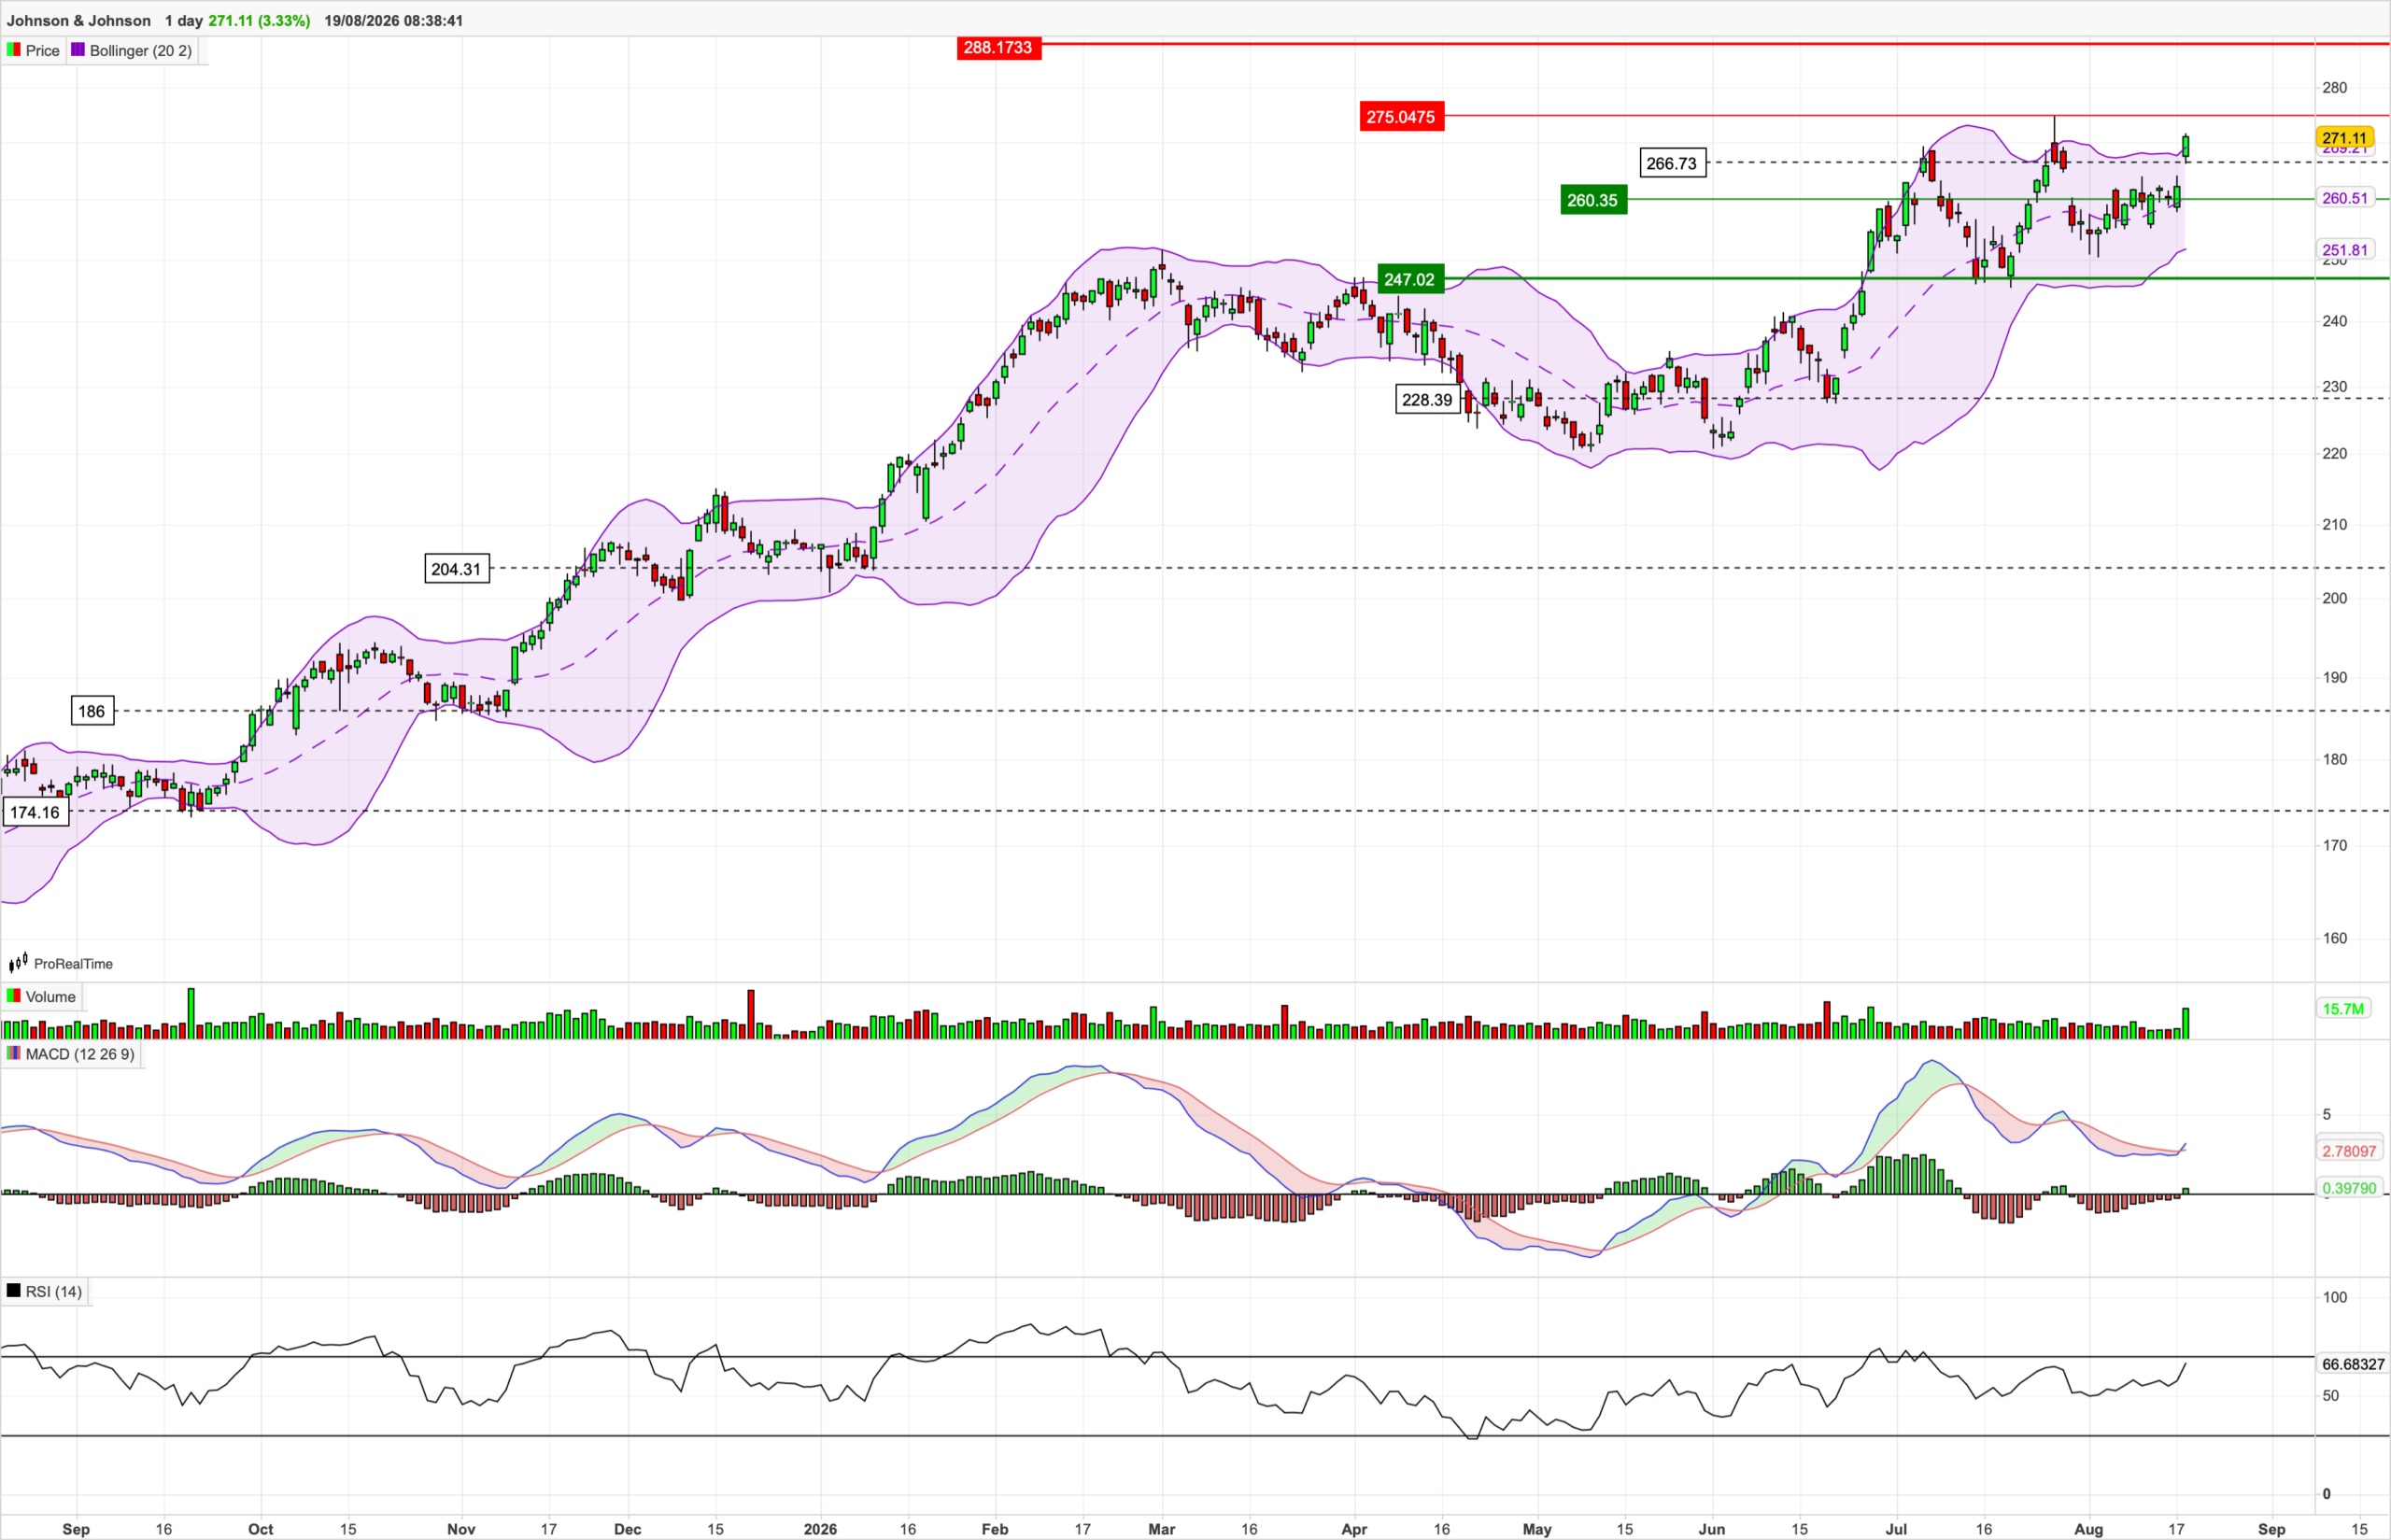
Following a consolidation in the spring, Johnson & Johnson has trended significantly upward again since June.
Starting from the area around $228, a dynamic upward movement began, which initially led the stock above the $247 mark and subsequently above the $260 level.
Following the strong rise, a comparatively orderly consolidation above important technical supports followed in July and August.
With the current rise to around $271, the stock is now once again approaching its recent resistance area.
From a technical analysis perspective, the medium-term market structure thus remains fundamentally positive.
The area around $260 developed into key support
The zone around $260 is particularly important at present.
A horizontal support is located in this area at approximately $260.35.
The midline of the Bollinger Bands is also currently running at almost the same level, at around $260.50.
From a technical perspective, this overlap increases the significance of this price level.
Should the zone hold in the future, this would further support the currently positive overall technical picture.
Conversely, a sustained break below the $260 area would weaken the recent upward structure.
Below that, the lower Bollinger Band at around $252 represents another technically relevant support zone.
The next resistance lies in the $275 area
The focus is now initially on the zone around $275.
The next clearly recognizable technical resistance area is located here at around $275.05.
With a current price of around $271, Johnson & Johnson is already trading immediately below it.
A sustained break above the $275 area could further confirm the currently positive chart setup and open up additional upside potential.
Bollinger Bands indicate improved momentum
During the consolidation in July and August, Johnson & Johnson initially moved within the Bollinger Bands.
With the recent recovery, the stock succeeded in rising significantly above the midline and subsequently reaching the upper Bollinger Band.
The midline is currently at around $261, while the lower band is at approximately $252.
The current price of around $271 is thus already moving at or slightly above the upper range of the Bollinger Bands.
This underscores the recently increased short-term momentum.
At the same time, a short-term consolidation would not be unusual after such a dynamic movement.
The decisive factor will now likely be whether the stock can stabilize above the $260 zone.
RSI confirms the improved dynamics
The Relative Strength Index (RSI) is currently at around 67 points.
This places Johnson & Johnson significantly above the neutral 50 mark, but still just below the frequently used overbought threshold of 70.
The indicator thus confirms the currently positive momentum.
At the same time, the RSI is now approaching a comparatively high level.
While this is not unusual within an intact uptrend, it increases the probability of short-term consolidations or profit-taking.
The MUMAK® valuation analysis had previously classified the RSI as positive.
MACD provides a positive short-term signal
The MACD has also improved again in recent trading days.
Following the consolidation phase, the MACD line has recently turned upward again and lies slightly above its signal line.
The indicator thus supports the recent upward movement.
It is also positive that this improvement is taking place within a fundamentally intact medium-term uptrend.
Several technical factors could currently support Johnson & Johnson
The interplay of several technical aspects appears particularly interesting:
- intact medium-term uptrend
- stabilization above the $260 area
- Bollinger midline at around $261 as important support
- lower Bollinger Band at around $252 as additional support
- current price at around $271
- resistance in the area of approximately $275
- next major resistance at around $288
- RSI at around 67 points
- MACD back above the signal line
- positive MACD histogram
- higher trading volume during the recent price increase
From our perspective, it is precisely this simultaneous occurrence of several constructive factors that increases the significance of the currently positive chart setup.
At the same time, following the strong development, the stock is already near the next resistance zone and the RSI is approaching the overbought range.
Why does Johnson & Johnson receive the RED HOT CHILI™ MUMAK?
The RED HOT CHILI™ MUMAK does not necessarily highlight the ‘best’ company.
It awards the company that, at the time of analysis, shows the greatest alignment across our five analysis levels.
We currently see this constellation in Johnson & Johnson.
Fundamental development remains robust.
Second-quarter results underscore operational strength.
The annual guidance was raised.
Innovative Medicine and MedTech continue to provide broad diversification.
Market sentiment is also generally positive when looking at analysts. The MUMAK® valuation analysis currently shows a consensus of “Accumulate.”
This picture is complemented by several constructive technical chart signals.
In the current MUMAK® valuation analysis, all five analysis levels are therefore rated positively. Johnson & Johnson thus achieves 5 out of 5 MUMAKS.
It is precisely this interplay that makes Johnson & Johnson the RED HOT CHILI™ MUMAK this week.
Core Message
Johnson & Johnson may have further confirmed its positive technical chart development in recent weeks.
Following stabilization in the area around $228, a new uptrend developed, leading the stock first above $247 and then above the important zone around $260.
Following a consolidation in July and August, Johnson & Johnson is now trading at around $271 again.
The focus is initially on the resistance area around $275. A sustained breakout above this could further confirm the recent upward movement.
Above that, the next significantly more pronounced technical resistance area is located at around $288.
On the downside, the Bollinger midline at around $261 is gaining importance. Below that, the next relevant support zone is in the area between approximately $247 and $252.
The combination of a fundamentally positive development and several constructive technical chart signals makes Johnson & Johnson one of the more interesting stocks within our analysis universe at present.
At the same time, however, caution remains advised. Following the strong price development, the stock is already trading near the next resistance at $275. With around 67 points, the RSI is also only just below the overbought range.
Fundamentally, Johnson & Johnson is trading at a valuation premium compared to parts of its peer group. At the same time, increasing biosimilar competition for Stelara and the ongoing talc litigation remain uncertainty factors.
From the perspective of the MUMAK® methodology, Johnson & Johnson therefore receives the RED HOT CHILI™ MUMAK award this week. 🔥📈
Note
There can only be one single RED HOT CHILI™ MUMAK at any given time.
The RED HOT CHILI™ MUMAK is an internal award of the MUMAK® methodology. It identifies the company that, at the time of publication, shows the highest alignment of the five MUMAK® analysis categories within our analysis universe.
The award is based on the MUMAK® methodology and our analysis of the current market situation. It describes what we consider to be the most convincing overall constellation within our analysis universe at the time of publication and does not constitute investment advice or a buy, hold, or sell recommendation.
The presented assessments reflect solely the opinion of MUMAK® at the time of publication and may change at any time. Past performance, current valuations, or awards do not allow for reliable conclusions about future performance.
Investments are associated with risks and can lead to the complete loss of the capital invested. Every investment decision should be based on an independent review and consideration of personal investment goals, investment horizon, and individual risk tolerance.
