

Why the stock is particularly convincing right now
With the RED HOT CHILI™ MUMAK, MUMAK® highlights every week the company that currently shows the greatest alignment across our five analysis levels:
- Geopolitics
- Industry
- Fundamentals
- News & Market Sentiment
- Technical Analysis
This week, Space Exploration Technologies Corp. – SpaceX receives this award.
The strong operational development, the increasing importance of Starlink, and the company’s strategic position within the aerospace and satellite industry form a fundamentally constructive starting position. In parallel, the overall short-term technical chart picture has also brightened recently following the significant correction of the past few weeks.
We have already extensively presented SpaceX’s fundamental valuation on MUMAK.me. The focus of this update is therefore on the current technical chart development.
Fundamental Quality Meets New Momentum
SpaceX is currently convincing not only through its strong market position and high structural growth.
From our perspective, the following factors in particular indicate a fundamentally positive starting position:
- strong revenue growth
- significant improvement in adjusted EBITDA
- Starlink as an increasingly important financial growth driver
- further increasing number of Starlink subscribers
- strong position in commercial rocket launches
- strategic importance for US space and defense infrastructure
This fundamental development forms the basis for the current RED HOT CHILI™ MUMAK award.
Technical Chart Analysis Provides Additional Support
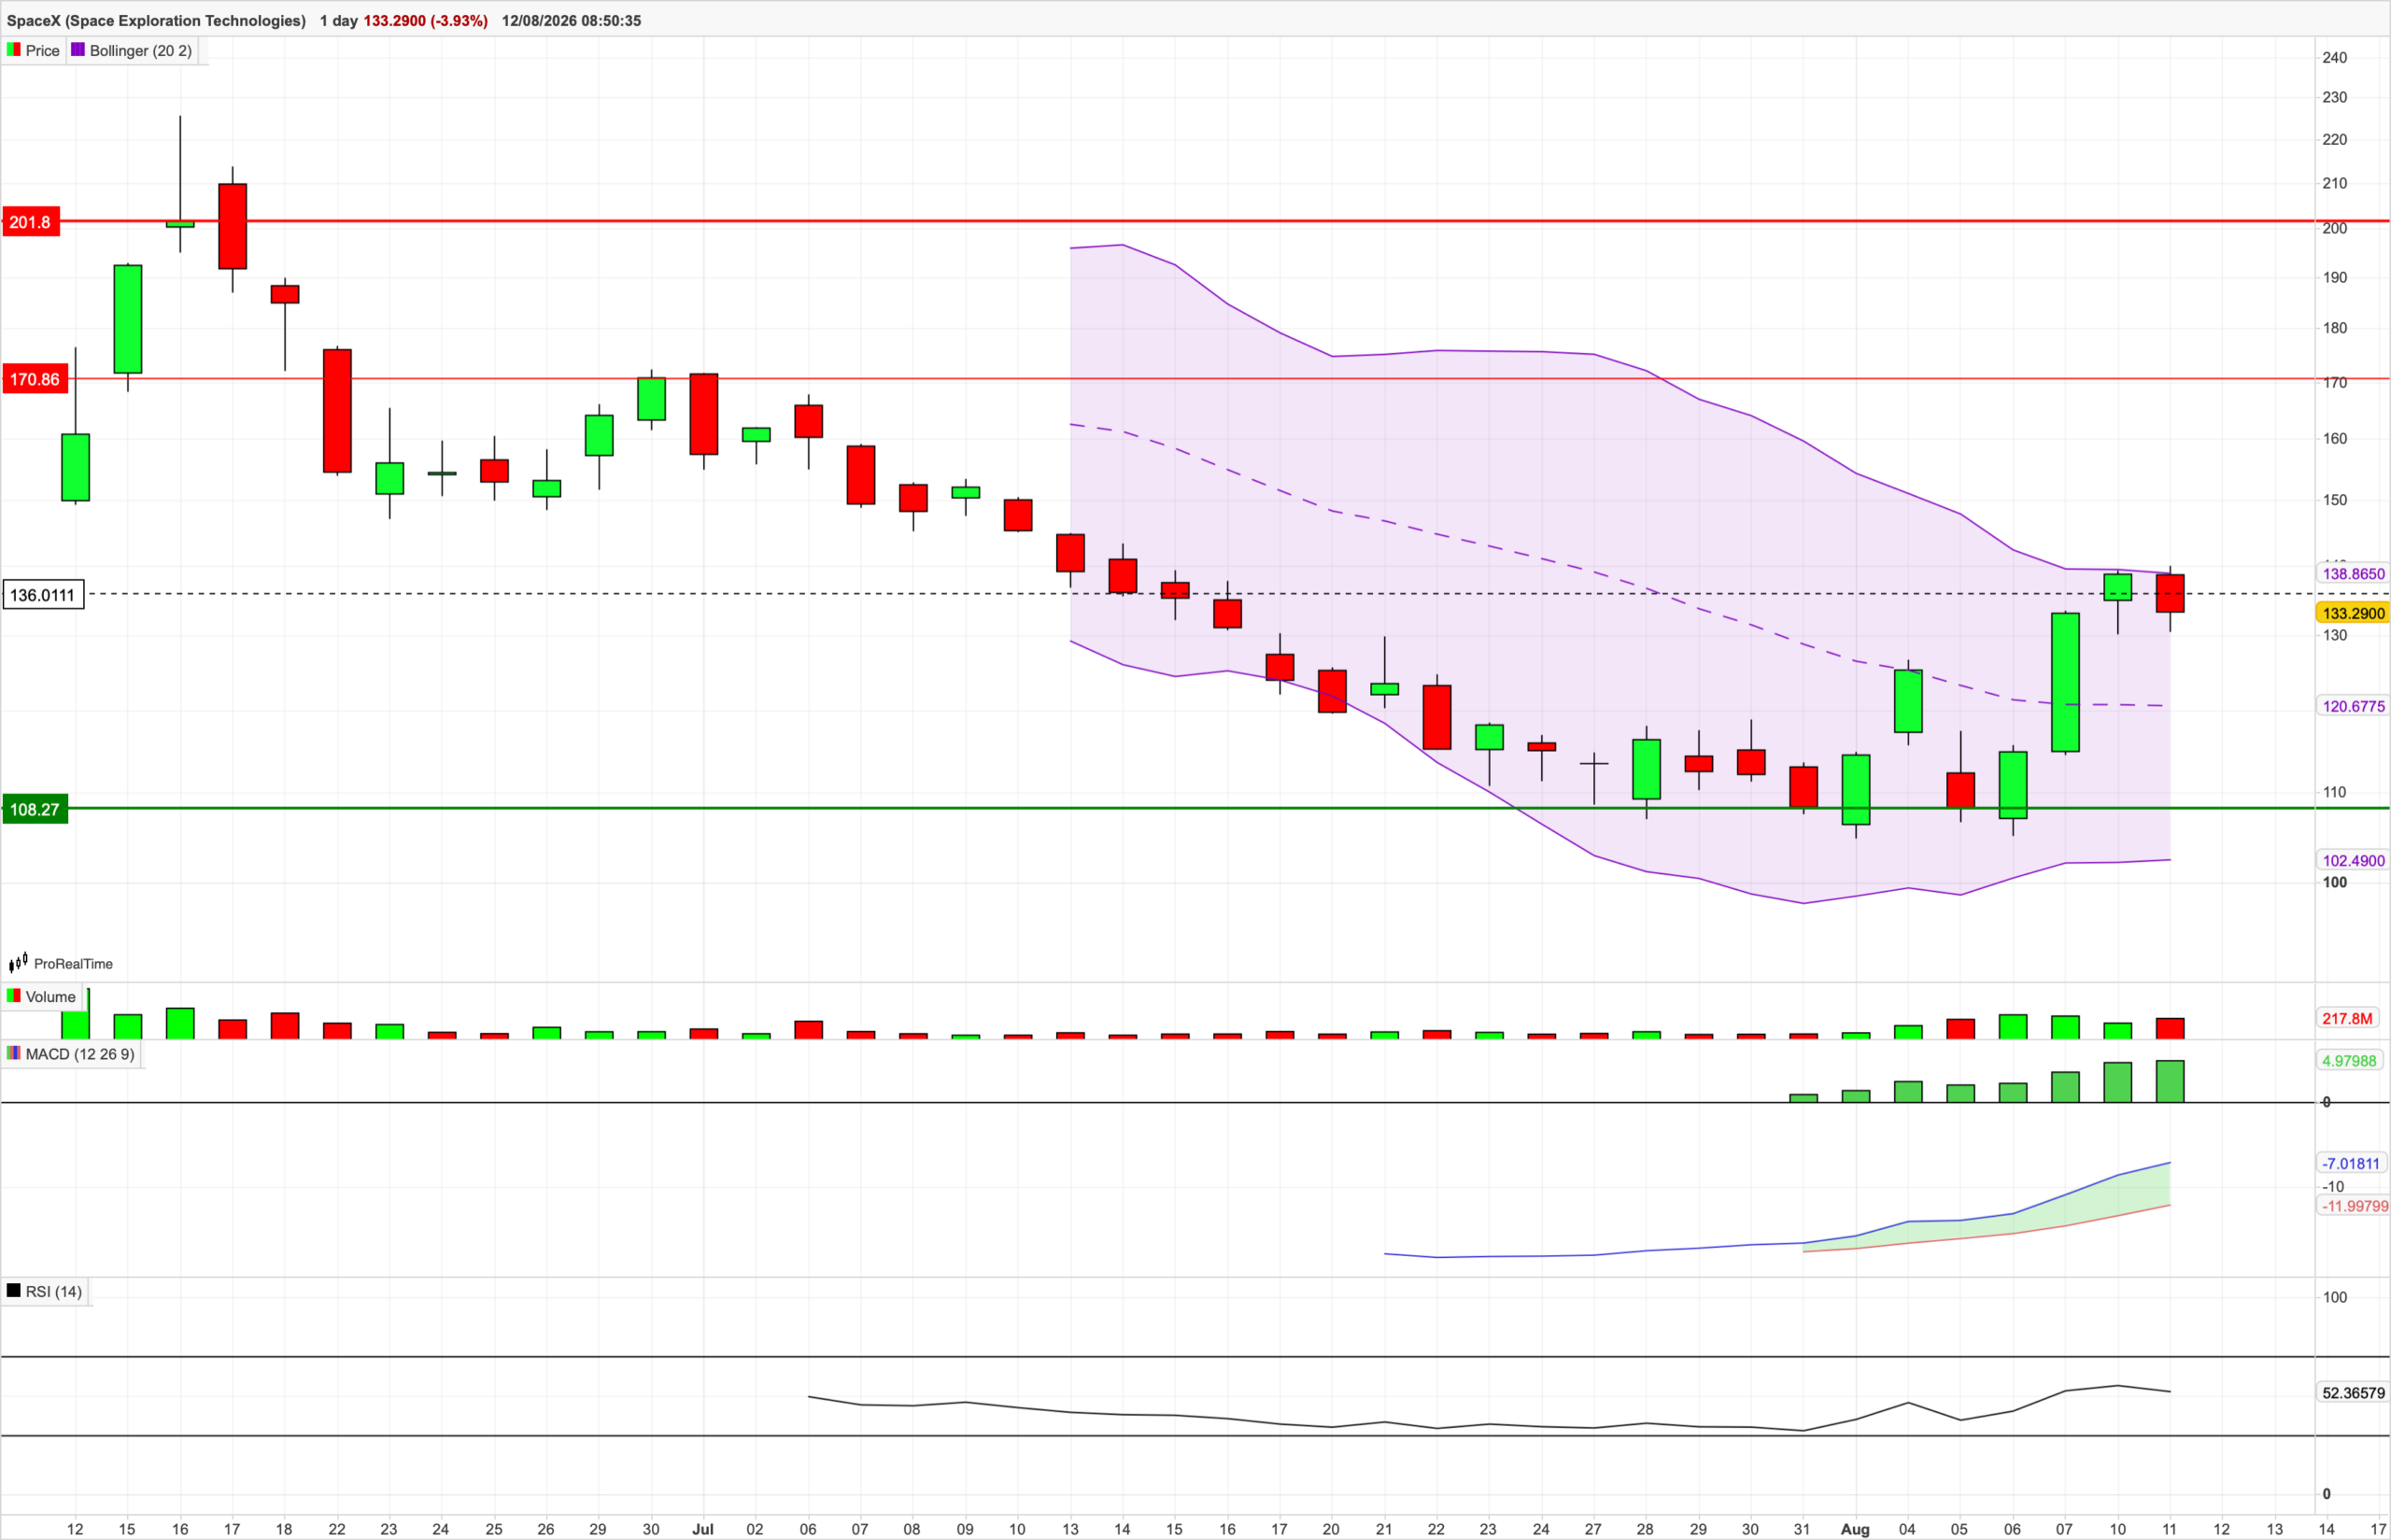
After a significant correction since the highs in June, SpaceX stabilized in the area of around $108 at the beginning of August.
From there, a dynamic counter-movement set in, which led the stock back to the area of just under $139 within a few trading days.
From a technical chart perspective, this has visibly improved the short-term market structure.
The stock is now trading significantly above the midline of the Bollinger Bands again. At the same time, RSI and MACD have also improved compared to their lows.
However, the recent movement should not yet be interpreted as a fully confirmed medium-term trend reversal.
The area around $108 developed into key support
The zone around $108 is particularly important right now.
The stock stabilized in this area at the beginning of August after the previously pronounced downward movement.
Should this zone hold in the future, it would provide additional support for the currently improved overall technical picture.
A sustained break below the $108 mark, on the other hand, would call the recent bottoming out into question and significantly cloud the technical picture once again.
The next resistance lies in the $139 area
The focus is now initially on the zone between approximately $136 and $139.
The upper Bollinger Band is currently located here at around $139. At the same time, the recent recovery movement initially reached its temporary high in this area.
With a current price of around $133, SpaceX is trading slightly below that again.
A sustained break above the $139 area could further confirm the short-term improved chart setup and open up additional upside potential.
The next more pronounced resistance area is then located at around $171.
Bollinger Bands suggest improved momentum
During the preceding correction, SpaceX moved in the lower half of the Bollinger Bands for long stretches.
With the recent recovery, it first managed to return above the midline and then made a dynamic climb to the upper Bollinger Band.
The midline is currently at around $121, while the upper band is at about $139.
This means the stock continues to trade significantly above its short-term Bollinger midline.
The pullback from the upper band is not unusual at first after the preceding dynamic movement.
The decisive factor now will likely be whether the stock can stabilize above the midline.
RSI confirms the improved momentum
The Relative Strength Index (RSI) is currently at around 52 points.
This means SpaceX is moving in neither overbought nor oversold territory.
Rather, the indicator is currently in a largely neutral zone.
On a positive note, however, the RSI improved significantly during the recent recovery and reclaimed the 50 mark.
The indicator thus confirms the improved short-term momentum without currently pointing to a technically overheated situation.
MACD provides a positive short-term signal
The MACD has also improved significantly over the past few trading days.
The MACD accordingly appears positive.
The indicator thus supports the recent recovery movement.
Several technical factors could currently favor SpaceX
The interplay of several technical aspects appears particularly interesting:
- Stabilization in the area of around $108
- dynamic recovery from the August low
- return above the midline of the Bollinger Bands
- Bollinger midline at around $121 as the first important support
- upper Bollinger Band at around $139 as a short-term resistance zone
- RSI back above 50
- MACD above the signal line
- higher trading volume during the recent recovery movement
In our view, it is precisely this simultaneous occurrence of several constructive factors that increases the significance of the currently improved chart setup.
At the same time, the technical situation remains comparatively vulnerable due to the short stock market history and continued high volatility.
Why does SpaceX receive the RED HOT CHILI™ MUMAK?
The RED HOT CHILI™ MUMAK does not honor the best company.
It honors the company that shows the greatest alignment across our five analysis levels at the respective time of analysis.
With SpaceX, we currently see exactly this constellation.
Fundamental development remains characterized by strong growth.
Starlink is increasingly developing into a significant financial growth driver.
The strategic position within the aerospace and satellite industry remains strong.
Market sentiment is also generally positive, looking at the analysts.
This picture is complemented by several improved technical chart signals.
It is precisely this interplay that makes SpaceX the RED HOT CHILI™ MUMAK this week.
Key Message
SpaceX may have stabilized technically after the significant correction of the past few weeks.
After forming support in the area of around $108, a dynamic recovery to just under $139 followed. The stock was able to reclaim the midline of the Bollinger Bands, while RSI and MACD improved at the same time.
The focus is now initially on the resistance area between $136 and $139. A sustained breakout above this could further confirm the recent recovery movement.
Above that, the next more pronounced technical resistance area is located at around $171.
On the downside, however, the Bollinger midline at around $121 is gaining importance. Below that, the zone around $108 remains the decisive support.
The combination of a fundamentally positive development and several constructive short-term technical chart signals currently makes SpaceX one of the more interesting stocks within our analysis universe.
At the same time, however, caution remains advised. The stock has shown extremely high volatility since the IPO, and the trading history to date is still comparatively short. Furthermore, the medium-term trend reversal is not yet fully confirmed technically.
From the perspective of the MUMAK® methodology, SpaceX therefore receives the RED HOT CHILI™ MUMAK award this week. 🔥📈
Note
There can only be one single RED HOT CHILI™ MUMAK at any given time.
The RED HOT CHILI™ MUMAK is an internal award of the MUMAK® methodology. It identifies the company that, at the time of publication, shows the highest alignment of the five MUMAK® analysis categories within our analysis universe.
The award is based on the MUMAK® methodology and our analysis of the current market situation. It describes what we consider to be the most convincing overall constellation within our analysis universe at the time of publication and does not constitute investment advice or a buy, hold, or sell recommendation.
The presented assessments reflect solely the opinion of MUMAK® at the time of publication and may change at any time. Past performance, current valuations, or awards do not allow for reliable conclusions about future performance.
Investments are associated with risks and can lead to the complete loss of the capital invested. Every investment decision should be based on an independent review and consideration of personal investment goals, investment horizon, and individual risk tolerance.
