
Halliburton
Analysis Result: 5 out of 5 MUMAKS
Brief Introduction – Halliburton
The energy sector remains heavily influenced by geopolitical developments and commodity market dynamics. Rising oil prices, investments in production capacity, and increasing energy demand are driving greater need for technical services along the value chain.
In this environment, companies operating as service providers for exploration and production particularly benefit, as they directly depend on rising investment budgets from oil and gas producers.
Halliburton is among the world’s leading providers in this segment. The company focuses on technologies, services, and infrastructure related to the development and optimization of oil and gas fields. This positions Halliburton as a key beneficiary of increasing activity in the upstream sector.
This analysis evaluates Halliburton according to the UMBRELLA Strategy using the MUMAK Method. The assessment is structured across five decision phases: Geopolitics, Industry, Fundamentals, Market Sentiment, and Technical Analysis. The objective is to derive opportunities and risks in a transparent manner and translate them into clear decision logic.
The conclusion upfront:
All five decision phases currently deliver a positive or at least neutral signal.
Halliburton therefore largely meets the criteria of the UMBRELLA Strategy according to the MUMAK Method.
This analysis structures the investment decision along five categories: Geopolitics, Industry, Fundamentals, Market Sentiment, and Technical Analysis.
The goal is not to predict the future precisely. The goal is orientation. We contextualize facts, demonstrate causal relationships, and structure a comprehensible decision logic.
We explain – you decide.
Rating
Geopolitics
Assessment
At the center of current developments is once again the Middle East. Escalating tensions between the United States and Iran are shifting oil market pricing—away from pure supply and demand dynamics toward geopolitical risk premiums.
A central uncertainty factor remains the Strait of Hormuz. Approximately 20% of global oil trade passes through this strait. The mere possibility of disruption is sufficient to embed risk premiums in the oil price.
Key Takeaway
A rising oil price has an indirectly positive effect on Halliburton—through increased investments by oil and gas producers. At the same time, the quality of this effect remains geopolitically fragile.
Rationale
The causal relationship can be clearly structured:
Indirect Leverage via CapEx
Halliburton does not sell commodities, but rather services and technologies in the upstream sector. The decisive variable is therefore not the oil price itself, but the investment behavior of producers.
Mechanics:
Rising oil prices
- higher profitability of extraction projects
- Rising investment budgets (CapEx)
- higher demand for services and technologies
Short-term Effect: Tailwinds
Higher oil prices lead to:
- improved margins for producers
- increasing project activity
- more intensive utilization of existing fields
This directly increases demand for drilling, production, and optimization services—Halliburton’s core business.
Medium-term Effect: Uncertainty
The current price increase is primarily geopolitically driven.
This leads to structural risks:
- Oil projects have long planning horizons (10–20 years)
- volatile prices complicate investment decisions
- geopolitical tensions increase planning uncertainty
Investments therefore react with a delay and not linearly to short-term price spikes.
Conclusion
Halliburton benefits in the short term from rising oil prices through higher investment activity in the upstream sector.
However, the foundation of this growth is geopolitically driven and therefore less stable than in fundamentally supported cycles.
Halliburton
Geopolitics Rating: positive
Industry
Assessment
The oilfield services industry is highly cyclical.
Demand does not depend directly on the oil price, but on the investment behavior of oil and gas producers.
Therefore, what matters is not only the price level, but the stability of investment cycles.
Key Takeaway
Halliburton has a strong market position at the center of oil production, but is heavily dependent on short-term and cyclical investment decisions.
Rationale
The causal relationship can be clearly structured:
Position in the Value Creation Core
As a service provider, Halliburton is directly integrated into exploration and production.
This means:
- immediate proximity to operational activity
- direct participation in increasing drilling and production intensity
Cyclical Demand
Demand for services is not structurally stable, but reactive.
Mechanics:
Rising oil prices
- higher margins for producers
- increasing investments
- higher demand for services
Falling oil prices work in the opposite direction—often quickly and significantly.
Dependence on the Shale Oil Sector
A substantial portion of activity is in the North American shale oil market.
Characteristics:
- short project cycles
- rapid adjustment of investments
- high volatility
This leads to increased sensitivity in revenue and pricing power.
Geographic Diversification
Halliburton is expanding its international presence.
Objective:
- more stable, longer-term projects
- reduced dependence on short-term U.S. cycles
Nevertheless, North America currently remains the most important driver.
Conclusion
Halliburton is strategically well positioned at the center of oil production.
However, demand remains cyclical and heavily influenced by short-term investment decisions.
Halliburton
Industry Rating: positive
Fundamentals
Assessment
Fundamental data reveal whether a company can actually translate current market dynamics into stable earnings and cash flows.
Key Takeaway
Halliburton remains operationally stable and cash flow-strong, but shows a significant weakening in profitability.
Rationale
The causal relationship can be clearly structured:
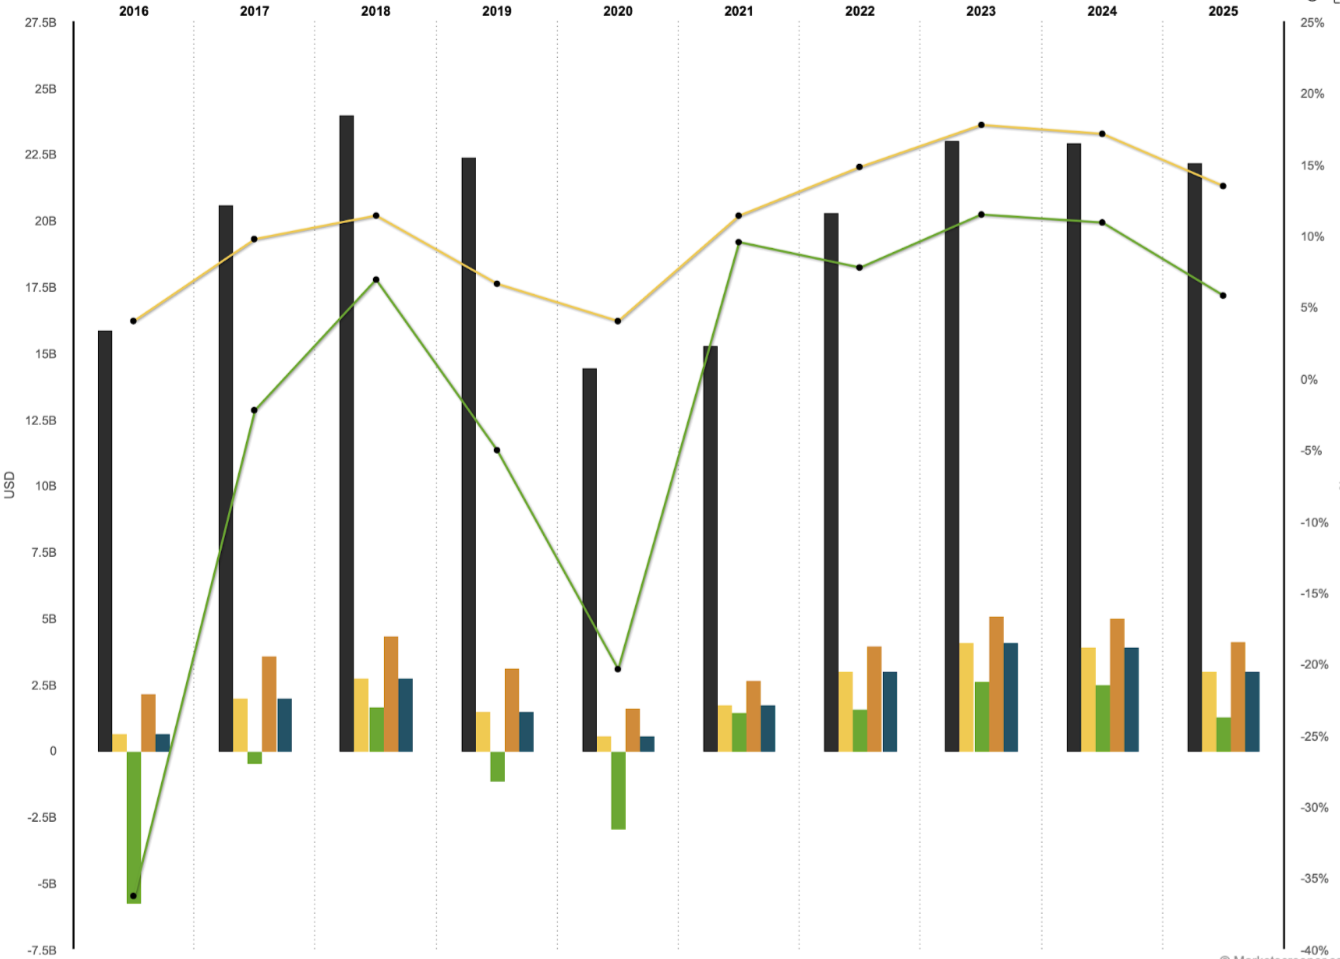
Revenue and Profit (Fiscal Year 2025)
| Revenue and Earnings (Fiscal Year 2025) | ||
|---|---|---|
| Revenue: | ~$22.2 billion | (slightly declining) |
| Net Income: | ~$1.3 billion | (significantly below previous year) |
The development shows:
| Margin Development | |
|---|---|
| EBITDA Margin: | ~19.1% |
| Net Margin: | ~5.8% (significantly below prior year) |
The EBITDA margin remains solid.
However, the decline in net margin signals increasing pressure on profitability.
→ widening gap between operating income and net income.
Rating
| Rating | |
|---|---|
| P/E 2026: | ~18 |
| P/E 2027: | ~15 |
The valuation is in the moderate range and reflects:
- stable operational base
- but subdued growth expectations
Cash Flow and Capital Discipline
| Cash Flow & Capital Discipline | Table Header |
|---|---|
| Operating Cash Flow: | ~$2.9 billion |
| Free Cash Flow: | ~$1.8 billion |
Halliburton continues to generate solid cash inflows.
These enable:
- Share buybacks (~$1 billion)
- Dividends (~1.7% yield)
Capital returns are currently supported more by cash flow than by earnings growth.
Conclusion
Halliburton has a stable economic foundation and strong cash flows.
However, declining profitability indicates that the company is in a more challenging phase of the cycle.
Halliburton
Fundamentals Rating: positive
News, Analysts, and Market Sentiment
Assessment
In addition to fundamental data, market opinions and capital flows also influence price performance.
Key Takeaway
Sentiment toward Halliburton is currently constructive, but remains cyclically influenced.
Rationale
Analyst Estimates
Analysts overall present a positive picture.
Buy consensus among over 20 analysts:
| Analyst Overview | Table Header |
|---|---|
| Average Price Target | approx. $37 |
| Upper Range: | $46.5 |
| Lower Range: | $28 |
This indicates confidence in operational development, while uncertainty remains present.
Market Positioning
Halliburton is typically classified as:
- indirect beneficiary of rising oil prices
- cyclical leverage on energy sector investments
The stock is therefore frequently part of:
- commodity strategies
- tactical energy allocations
Capital Flows
Institutional investors often use oilfield services stocks for:
- participation in rising upstream investments
- short-term positioning in the energy cycle
Capital flows react sensitively to oil price movements and investment expectations.
Conclusion
Sentiment and analyst assessments currently support the picture.
At the same time, market sentiment remains clearly cyclically influenced.
Halliburton
Market Sentiment Rating: positive
Technical Analysis
Assessment
Technical analysis structures the timing framework for a position.
Key Takeaway
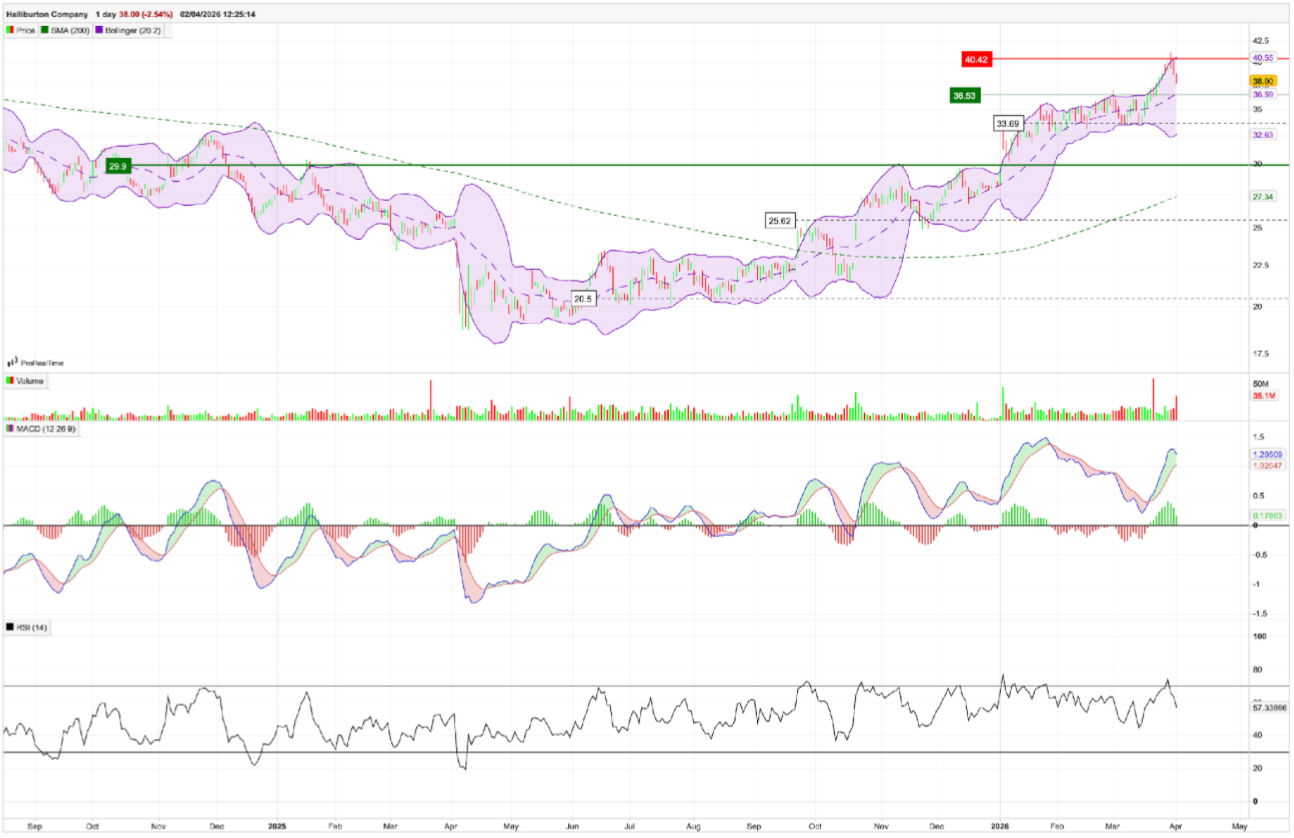
The technical structure of Halliburton shows a stable uptrend with a short-term consolidation or resistance zone.
Rationale
Bollinger Bands
The price is currently moving near or at the upper Bollinger Band.
This signals:
- sustained trend strength
- elevated volatility within the uptrend
At the same time, proximity to the band suggests a possible short-term consolidation.
RSI
The RSI is in the range of ~55–60.
This means:
- Uptrend intact (above 50)
- no overheating (below 70)
→ room for further upward movement available
MACD
The MACD shows positive momentum with rising tendency.
This signals:
- intact trend
- increasing momentum after
Trend Structure and Resistance
The price has clearly detached from earlier lows (~$20) and built a series of higher highs and higher lows.
Currently relevant:
- Resistance in the ~$40–41 range
- Support in the ~$36–37 range
A sustained breakout above resistance would confirm and continue the trend.
Volume
Rising volume during upward movements supports the current trend structure.
→ buyers dominate the market
Conclusion
The technical structure confirms an intact uptrend with constructive momentum.
In the short term, resistance exists in the area of recent highs, but the medium-term setup remains positive.
Halliburton
Technical Analysis Rating: positive
Summary
The analysis shows a consistent overall picture.
Geopolitics → Industry → Fundamentals → Sentiment → Technical Analysis
All five levels deliver a positive signal.
Halliburton is currently benefiting from rising oil prices through higher investments in the upstream sector. At the same time, the company demonstrates a stable operational base, strong cash flows, and a constructive market position at the center of oil production.
Decision Logic
- geopolitical tailwinds via rising oil prices
- strong position in the operational core of the industry
- stable fundamentals with solid cash flow
- positive market sentiment and analyst support
- intact technical uptrend
Rating According to the MUMAK Method
| Category | Rating |
|---|---|
| Geopolitics | Positive |
| Industry | Positive |
| Fundamentals | Positive |
| News & Sentiment | Positive |
| Technical Analysis | Positive |
Overall Rating